## Aircraft Collision Diagrams
### Overview
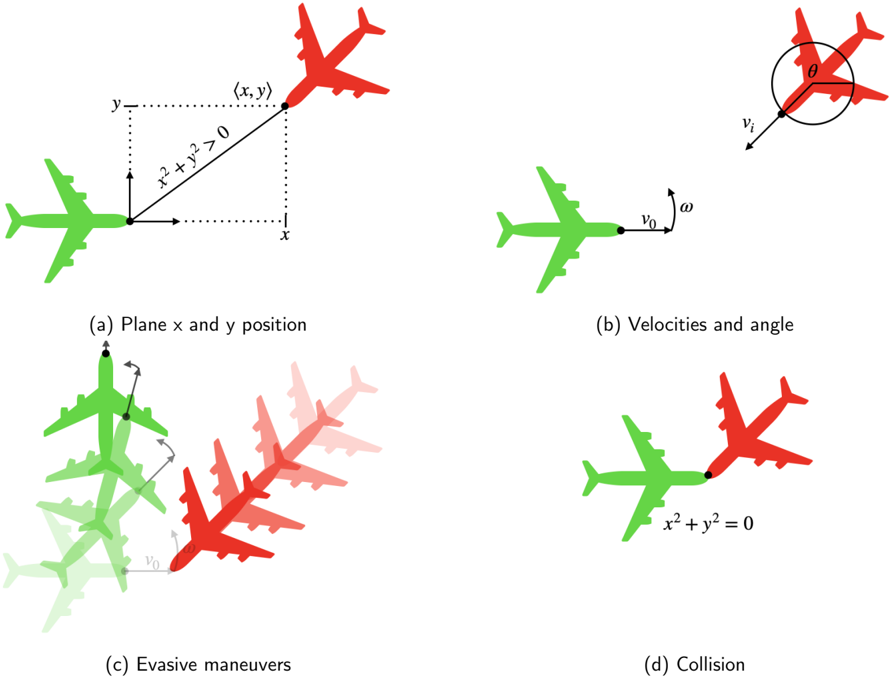
The image presents four diagrams illustrating different aspects of aircraft interaction, including relative positioning, velocities, evasive maneuvers, and collision scenarios. Two aircraft are depicted, one green and one red, to represent different entities or states.
### Components/Axes
* **Diagram (a): Plane x and y position**
* Two-dimensional coordinate system with x and y axes.
* Green aircraft at the origin (0,0).
* Red aircraft at a point (x, y) in the first quadrant.
* Distance between the aircraft is represented by the equation x² + y² > 0.
* **Diagram (b): Velocities and angle**
* Green aircraft with velocity vector v₀ and angular velocity ω.
* Red aircraft with velocity vector vᵢ and angle θ.
* **Diagram (c): Evasive maneuvers**
* Green aircraft performing a maneuver with possible positions shown in lighter green.
* Red aircraft performing a maneuver with possible positions shown in lighter red.
* Velocity vector v₀ is shown for the red aircraft.
* **Diagram (d): Collision**
* Green and red aircraft colliding.
* Collision point represented by the equation x² + y² = 0.
### Detailed Analysis
* **Diagram (a): Plane x and y position**
* The green aircraft is positioned at the origin of the coordinate system.
* The red aircraft is located at a point (x, y) in the first quadrant.
* A dashed line forms a right triangle, with the x and y axes as legs and the distance between the aircraft as the hypotenuse.
* The equation x² + y² > 0 indicates that the distance between the aircraft is greater than zero, meaning they are not at the same location.
* **Diagram (b): Velocities and angle**
* The green aircraft has a velocity vector v₀ pointing to the right and an angular velocity ω.
* The red aircraft has a velocity vector vᵢ and an angle θ.
* **Diagram (c): Evasive maneuvers**
* The green aircraft is shown performing a maneuver, with multiple ghosted images indicating its possible positions.
* The red aircraft is also shown performing a maneuver, with multiple ghosted images indicating its possible positions.
* The velocity vector v₀ is shown for the red aircraft.
* **Diagram (d): Collision**
* The green and red aircraft are shown colliding.
* The equation x² + y² = 0 indicates that the distance between the aircraft is zero, meaning they are at the same location.
### Key Observations
* The diagrams illustrate different scenarios of aircraft interaction, from relative positioning to collision.
* The use of color (green and red) helps to distinguish between the two aircraft.
* The equations x² + y² > 0 and x² + y² = 0 represent the distance between the aircraft in different scenarios.
### Interpretation
The diagrams provide a visual representation of aircraft interaction, highlighting the importance of relative positioning, velocities, and maneuvers in avoiding collisions. The use of equations helps to quantify the distance between the aircraft and the likelihood of a collision. The diagrams can be used to illustrate the concepts of aircraft dynamics and collision avoidance.