\n
## Diagram: Aircraft Collision Avoidance Scenarios
### Overview
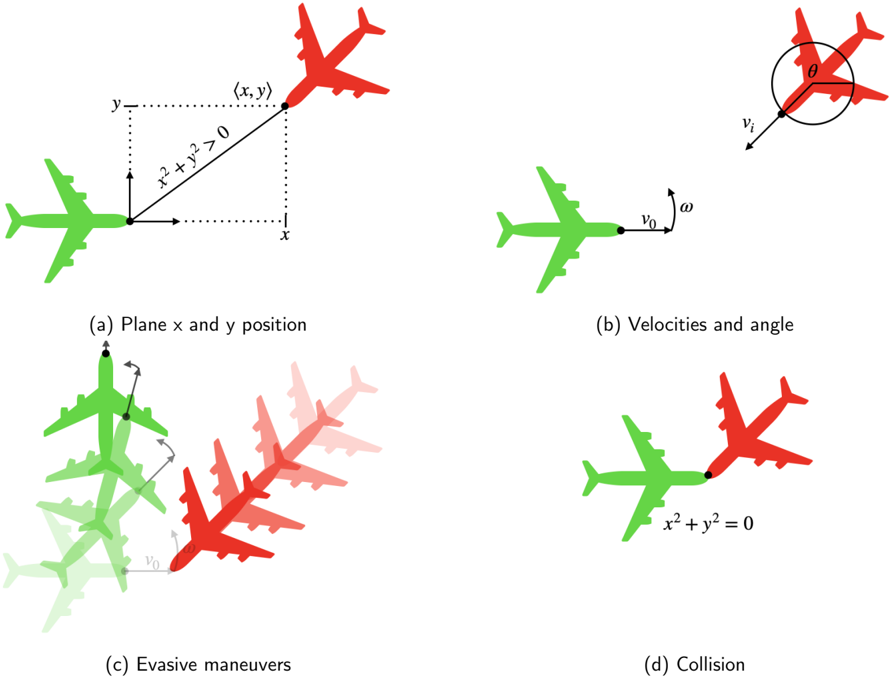
The image presents a series of four diagrams illustrating different stages and scenarios related to aircraft proximity and potential collision. Each diagram depicts two airplanes, one green and one red, with associated coordinate systems, velocity vectors, and annotations describing the situation. The diagrams appear to be part of a technical explanation of collision avoidance systems or flight dynamics.
### Components/Axes
The diagrams utilize the following components:
* **Aircraft Representations:** Simplified depictions of airplanes, colored green and red to distinguish them.
* **Coordinate System:** A Cartesian coordinate system (x, y) is present in diagrams (a) and (d).
* **Velocity Vectors:** Arrows representing the velocity of the green aircraft (v₀) and the relative velocity (vᵣ) in diagrams (b) and (c).
* **Angle:** An angle θ is shown in diagram (b).
* **Mathematical Equations:** Equations are included in diagrams (a) and (d): x² + y² > 0 and x² + y² = 0.
* **Labels:** Each diagram is labeled (a) through (d) with descriptive titles.
* **Evasive Maneuvers:** Multiple ghosted images of the green aircraft are shown in diagram (c) to represent possible maneuvers.
### Detailed Analysis or Content Details
**(a) Plane x and y position:**
* Two airplanes are shown, one green and one red.
* The red airplane is positioned at coordinates (x, y).
* The equation x² + y² > 0 is displayed, indicating the distance from the origin is positive.
* The x and y axes are labeled.
**(b) Velocities and angle:**
* A green airplane is shown with a velocity vector labeled v₀.
* A circular diagram shows a relative velocity vector vᵣ at an angle θ to the horizontal.
* The angle θ is indicated within the circular diagram.
**(c) Evasive maneuvers:**
* A green airplane is shown with a velocity vector labeled v₀.
* Multiple, semi-transparent images of the green airplane are shown, illustrating potential evasive maneuvers.
* A red airplane is positioned in the background.
* The relative velocity vector is shown.
**(d) Collision:**
* Two airplanes, one green and one red, are shown directly overlapping.
* The equation x² + y² = 0 is displayed, indicating the distance from the origin is zero.
* The x and y axes are labeled.
### Key Observations
* The diagrams progress from a scenario of separation (a) to potential collision (d).
* Diagram (b) introduces the concept of relative velocity and angle.
* Diagram (c) explores potential evasive maneuvers.
* The mathematical equations in (a) and (d) quantify the distance between the aircraft and the origin.
* The use of color (green and red) consistently represents the two aircraft throughout the diagrams.
### Interpretation
The diagrams illustrate a simplified model of an aircraft collision avoidance scenario. Diagram (a) represents a safe separation where the distance between the aircraft and a reference point is positive. Diagram (b) introduces the concept of relative velocity, which is crucial for predicting potential collisions. Diagram (c) demonstrates how evasive maneuvers can be used to alter the trajectory of an aircraft and avoid a collision. Finally, diagram (d) depicts a collision scenario where the distance between the aircraft and the origin is zero.
The diagrams suggest a system where monitoring relative velocity and distance is critical for collision avoidance. The evasive maneuvers shown in (c) imply a control system capable of altering the aircraft's trajectory based on predicted collision risks. The mathematical equations provide a quantitative basis for assessing the risk of collision. The diagrams are likely part of a larger explanation of collision avoidance systems, flight dynamics, or air traffic control.