## Line Chart: Probability of AI Surpassing Humanity Over Time
### Overview
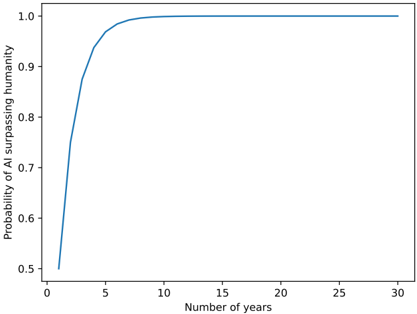
The image is a line chart illustrating the probability of AI surpassing humanity over a period of years. The x-axis represents the number of years, ranging from 0 to 30. The y-axis represents the probability of AI surpassing humanity, ranging from 0.5 to 1.0. The chart shows a single data series, represented by a blue line, which increases rapidly in the initial years and then plateaus near a probability of 1.0.
### Components/Axes
* **X-axis:** Number of years, with markers at 0, 5, 10, 15, 20, 25, and 30.
* **Y-axis:** Probability of AI surpassing humanity, with markers at 0.5, 0.6, 0.7, 0.8, 0.9, and 1.0.
* **Data Series:** A single blue line representing the probability of AI surpassing humanity over time.
### Detailed Analysis
The blue line starts at approximately 0.5 probability at year 0.
* **Year 0:** Probability ~0.5
* **Year 1:** Probability ~0.65
* **Year 2:** Probability ~0.78
* **Year 3:** Probability ~0.86
* **Year 4:** Probability ~0.91
* **Year 5:** Probability ~0.94
* **Year 10:** Probability ~0.99
* **Year 15:** Probability ~1.0
* **Year 20:** Probability ~1.0
* **Year 25:** Probability ~1.0
* **Year 30:** Probability ~1.0
The line increases sharply between year 0 and year 5, and then gradually approaches 1.0, plateauing around year 10.
### Key Observations
* The probability of AI surpassing humanity increases rapidly in the first few years.
* The probability approaches 1.0 (certainty) within approximately 10 years.
* The rate of increase slows down significantly after the first 5 years.
### Interpretation
The chart suggests that, according to this model, the probability of AI surpassing humanity increases rapidly in the near future and becomes almost certain within a decade. The initial rapid increase indicates a period of significant advancement or change, while the plateau suggests that the probability reaches a saturation point. This could be interpreted as a prediction that AI will likely surpass humanity within a relatively short timeframe, based on the assumptions and model used to generate this data.