## Line Graph: Probability of AI Surpassing Humanity Over Time
### Overview
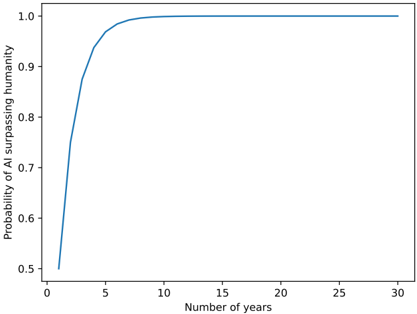
The image depicts a line graph illustrating the probability of artificial intelligence (AI) surpassing human capabilities over a 30-year period. The probability rises sharply from 0.5 to 1.0 within the first 5 years, then remains constant at 1.0 for the remaining 25 years.
### Components/Axes
- **X-axis (Horizontal)**: Labeled "Number of years," with increments marked at 0, 5, 10, 15, 20, 25, and 30. The scale spans 0 to 30 years.
- **Y-axis (Vertical)**: Labeled "Probability of AI surpassing humanity," with increments marked at 0.5, 0.6, 0.7, 0.8, 0.9, and 1.0. The scale spans 0.5 to 1.0.
- **Line**: A single blue line represents the probability trend. No legend is present to confirm the line's meaning, but contextual labels suggest it corresponds to the y-axis metric.
### Detailed Analysis
- **Initial Probability (0 years)**: The line begins at approximately **0.5** (50% probability) at the 0-year mark.
- **Rapid Increase (0–5 years)**: The line ascends steeply, reaching **1.0** (100% probability) by approximately **5 years**.
- **Plateau (5–30 years)**: The line remains flat at **1.0** for the duration of the graph (25 additional years).
### Key Observations
1. **Sharp Threshold**: The probability transitions from 50% to 100% within the first 5 years, indicating a critical inflection point.
2. **Certainty Post-5 Years**: After 5 years, the probability is modeled as absolute (1.0), suggesting no uncertainty in AI surpassing humanity.
3. **No Intermediate Values**: The graph lacks intermediate data points between 0 and 5 years, obscuring the exact trajectory of the rise.
### Interpretation
The graph implies a binary outcome: AI either surpasses humanity within 5 years (with certainty) or not at all. The initial 50% probability at year 0 may reflect baseline uncertainty, while the abrupt rise to 1.0 suggests a modeled tipping point. The absence of a legend or uncertainty bands (e.g., confidence intervals) limits interpretability, as the graph assumes deterministic outcomes after 5 years. This could represent a simplified model for illustrative purposes, potentially overlooking gradual advancements or probabilistic variability in real-world scenarios.