## Combined Bar Charts: Performance Analysis of LLMs
### Overview
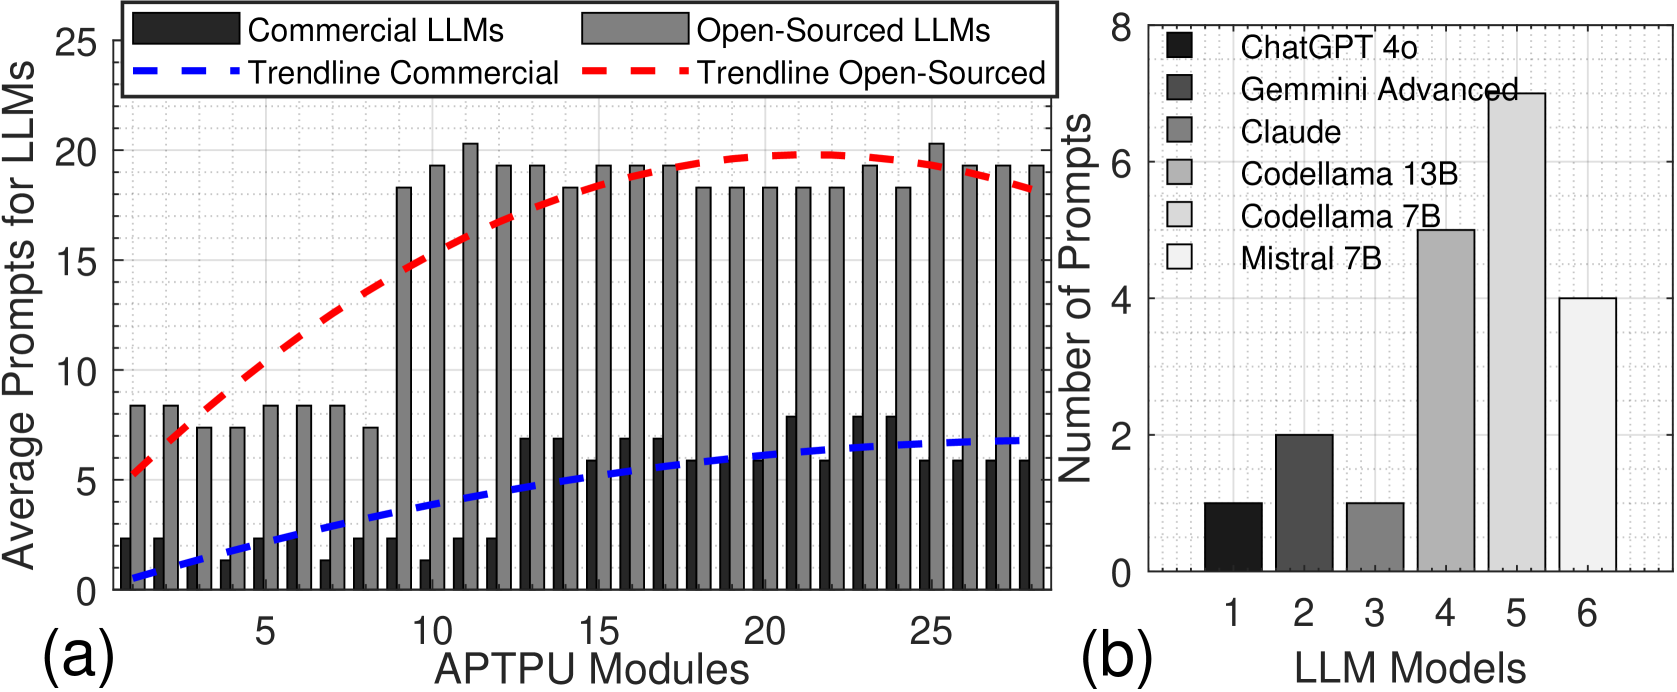
The image displays two distinct bar charts, labeled (a) and (b).
* **Chart (a)** compares the "Average Prompts for LLMs" between "Commercial LLMs" and "Open-Sourced LLMs" across a range of "APTPU Modules" (1 through 28). It includes trendlines for both categories.
* **Chart (b)** displays the "Number of Prompts" for six specific LLM models, labeled 1 through 6.
### Components/Axes
**Chart (a):**
* **X-Axis:** "APTPU Modules", scaled from 0 to 28, with major ticks every 5 units.
* **Y-Axis:** "Average Prompts for LLMs", scaled from 0 to 25, with major ticks every 5 units.
* **Legend (Top):**
* **Commercial LLMs:** Represented by black bars.
* **Open-Sourced LLMs:** Represented by grey bars.
* **Trendline Commercial:** Blue dashed line.
* **Trendline Open-Sourced:** Red dashed line.
**Chart (b):**
* **X-Axis:** "LLM Models", labeled 1 through 6.
* **Y-Axis:** "Number of Prompts", scaled from 0 to 8, with major ticks every 2 units.
* **Legend (Top-Left):** Maps the bars (1-6) to specific models:
1. **ChatGPT 4o** (Black)
2. **Gemmini Advanced** (Dark Grey)
3. **Claude** (Medium Grey)
4. **Codellama 13B** (Light Grey)
5. **Codellama 7B** (Lighter Grey)
6. **Mistral 7B** (White/Very Light Grey)
---
### Detailed Analysis
#### Chart (a): Average Prompts vs. APTPU Modules
* **Trend Verification:**
* **Commercial LLMs (Black Bars):** The trendline (blue dashed) shows a gradual, linear upward slope. The bars start near 0-2 prompts and rise to approximately 6-8 prompts by module 28.
* **Open-Sourced LLMs (Grey Bars):** The trendline (red dashed) shows a curvilinear trend. It starts at ~5, rises sharply to a peak around module 20, and then slightly declines.
* **Data Points:**
* **Modules 1-8:** Commercial LLMs are consistently low (approx. 2-3 prompts). Open-Sourced LLMs are consistently higher (approx. 8 prompts).
* **Modules 9-28:** There is a distinct "step-up" in performance for Open-Sourced LLMs, jumping to a range of ~18-20 prompts. Commercial LLMs show a slow, steady increase from ~4 to ~8 prompts over this same period.
* **Peak:** The highest performance for Open-Sourced LLMs appears around module 11 (approx. 20.3 prompts) and module 24 (approx. 20.3 prompts).
#### Chart (b): Number of Prompts per LLM Model
* **Data Points (Approximate):**
* **1 (ChatGPT 4o):** 1 prompt.
* **2 (Gemmini Advanced):** 2 prompts.
* **3 (Claude):** 1 prompt.
* **4 (Codellama 13B):** 5 prompts.
* **5 (Codellama 7B):** 7 prompts.
* **6 (Mistral 7B):** 4 prompts.
---
### Key Observations
* **Performance Gap:** In Chart (a), Open-Sourced LLMs significantly outperform Commercial LLMs in terms of "Average Prompts" across all tested APTPU modules.
* **Step-Function:** There is a clear inflection point for Open-Sourced LLMs at module 9, where performance jumps from ~8 to ~18.
* **Model Variance:** In Chart (b), there is high variance in prompt counts among the models. The "Codellama" family (7B and 13B) shows significantly higher prompt counts (5-7) compared to the proprietary models like ChatGPT 4o and Claude (1).
### Interpretation
The data suggests a strong correlation between model type and the "Average Prompts" metric within the context of "APTPU Modules" (likely referring to a specific hardware configuration, such as Tensor Processing Units).
The discrepancy between the two charts is notable:
1. **Chart (a)** implies that "Open-Sourced LLMs" as a category are highly efficient or capable of handling higher prompt volumes on this hardware.
2. **Chart (b)** provides a granular look at specific models, showing that the "Codellama" models (which are open-source) handle more prompts than the proprietary models listed (ChatGPT 4o, Gemmini, Claude).
**Reading between the lines:** The "APTPU Modules" likely represent a scaling factor for compute resources. The data demonstrates that Open-Sourced models are better optimized for this specific hardware architecture, or that the proprietary models are being throttled or are less efficient in this specific testing environment. The "step-up" at module 9 in Chart (a) suggests a threshold effect where the Open-Sourced models gain a significant advantage once a certain amount of hardware resource is allocated.