\n
## Diagram: Dependency Graph
### Overview
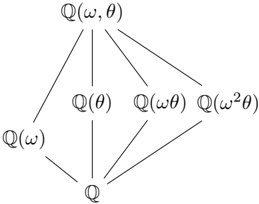
The image depicts a directed acyclic graph (DAG) representing dependencies between different functions or states denoted by mathematical expressions involving 'Q', 'ω', and 'θ'. The graph illustrates a hierarchical relationship where nodes higher in the diagram depend on nodes lower down.
### Components/Axes
The diagram consists of nodes labeled with mathematical expressions and directed edges indicating dependencies. The nodes are arranged in a roughly pyramidal structure. The nodes are:
* Q(ω, θ) - Top node
* Q(θ)
* Q(ωθ)
* Q(ω²θ)
* Q(ω)
* Q - Bottom node
The edges represent dependencies, pointing from a dependent node to a node it relies on.
### Detailed Analysis or Content Details
The graph shows the following dependencies:
* **Q(ω, θ)** depends on **Q(θ)**, **Q(ωθ)**, and **Q(ω²θ)**.
* **Q(θ)** depends on **Q**.
* **Q(ωθ)** depends on **Q**.
* **Q(ω²θ)** depends on **Q**.
* **Q(ω)** depends on **Q**.
* **Q** is the base node and has no dependencies.
The arrangement suggests a recursive or iterative process where the higher-level functions are built upon the lower-level ones.
### Key Observations
The diagram is symmetrical in the sense that Q(θ), Q(ωθ), and Q(ω²θ) all depend directly on Q. Q(ω, θ) is the most complex function, relying on all three intermediate functions. The use of 'ω' and 'θ' suggests these might be parameters or variables influencing the function 'Q'.
### Interpretation
This diagram likely represents a computational process or a system of equations where the value of a function Q(ω, θ) is determined by the values of its constituent functions Q(θ), Q(ωθ), and Q(ω²θ). The 'ω' and 'θ' parameters likely represent some form of transformation or scaling applied to the base function Q. The structure suggests a decomposition of a complex problem into smaller, more manageable subproblems. The graph could represent a signal processing system, a mathematical transformation, or a state machine. The repeated use of 'Q' suggests a core operation being applied with different inputs. The powers of 'ω' (ω, ωθ, ω²θ) suggest a frequency or phase-related transformation. Without further context, it's difficult to determine the precise meaning of the diagram, but it clearly illustrates a hierarchical dependency structure.