## State Transition Diagram: Resource Acquisition
### Overview
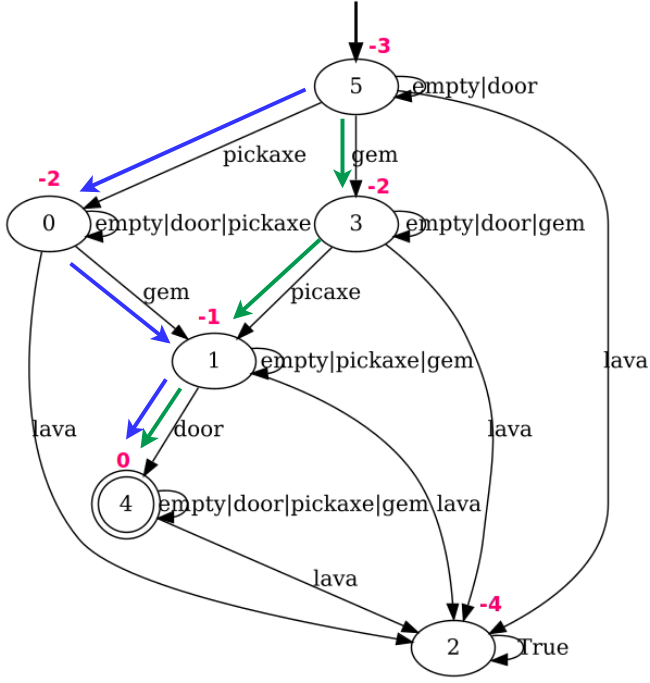
The image is a state transition diagram representing a system that transitions between states based on resource acquisition and environmental factors. The diagram consists of nodes representing states, and directed edges representing transitions between states, labeled with the conditions that trigger the transition and associated costs.
### Components/Axes
* **Nodes:** Represented by circles, each labeled with a number (0, 1, 2, 3, 4, 5) indicating the state. State 4 is a double circle, indicating it is an accepting state.
* **Edges:** Directed arrows connecting the nodes, indicating possible transitions between states. Each edge is labeled with a condition (resource or event) and a cost (shown in magenta).
* **Conditions:** Text labels on the edges, indicating the resources or events that trigger the transition (e.g., "empty|door|pickaxe", "gem", "lava").
* **Costs:** Numerical values in magenta near the edges, representing the cost associated with the transition (e.g., -1, -2, -3, -4, 0).
* **Colors:** Edges are colored either blue or green.
### Detailed Analysis
* **State 5:**
* Initial state, indicated by an incoming arrow from the top.
* Transition to State 3 (green arrow) with condition "gem" and cost -2.
* Transition to State 0 (blue arrow) with condition "pickaxe" and cost -2.
* Self-loop with condition "empty|door" and no cost indicated.
* **State 3:**
* Transition to State 1 (green arrow) with condition "picaxe" and cost -1.
* Transition to State 2 (black arrow) with condition "lava" and no cost indicated.
* Self-loop with condition "empty|door|gem" and no cost indicated.
* **State 0:**
* Transition to State 1 (blue arrow) with condition "gem" and cost -1.
* Transition to State 4 (blue arrow) with condition "door" and cost 0.
* Self-loop with condition "empty|door|pickaxe" and no cost indicated.
* **State 1:**
* Transition to State 2 (black arrow) with condition "lava" and no cost indicated.
* Self-loop with condition "empty|pickaxe|gem" and no cost indicated.
* **State 4:**
* Accepting state (double circle).
* Transition to State 2 (black arrow) with condition "lava" and no cost indicated.
* Self-loop with condition "empty|door|pickaxe|gem|lava" and no cost indicated.
* **State 2:**
* Transition to itself (self-loop) with condition "True" and cost -4.
### Key Observations
* The diagram represents a system where the state changes based on acquiring resources ("gem", "pickaxe", "door") or encountering environmental factors ("lava").
* Transitions have associated costs, indicated by the magenta numbers.
* State 4 is the accepting state, suggesting a successful outcome.
* The "empty" condition appears in conjunction with other resources, possibly indicating the absence of those resources.
* The "True" condition on the self-loop of State 2 suggests a stable state that is maintained indefinitely with a cost.
### Interpretation
The state transition diagram models a resource acquisition process. The system starts in State 5 and transitions between states based on the availability of resources like "gem", "pickaxe", and "door", and the presence of "lava". The magenta numbers represent the cost associated with each transition, which could be interpreted as energy expenditure, risk, or other negative consequences. The goal of the system appears to be reaching State 4, the accepting state, which likely represents a successful completion of the resource acquisition task. The self-loop in State 2 with the "True" condition and a cost of -4 suggests a state where the system is stuck in a loop, continuously incurring a cost without progressing towards the goal. The blue and green arrows may represent different types of actions or strategies for acquiring resources. The diagram provides a visual representation of the possible states, transitions, and costs involved in the resource acquisition process, allowing for analysis and optimization of the system's behavior.