\n
## Diagram: State Transition Diagram
### Overview
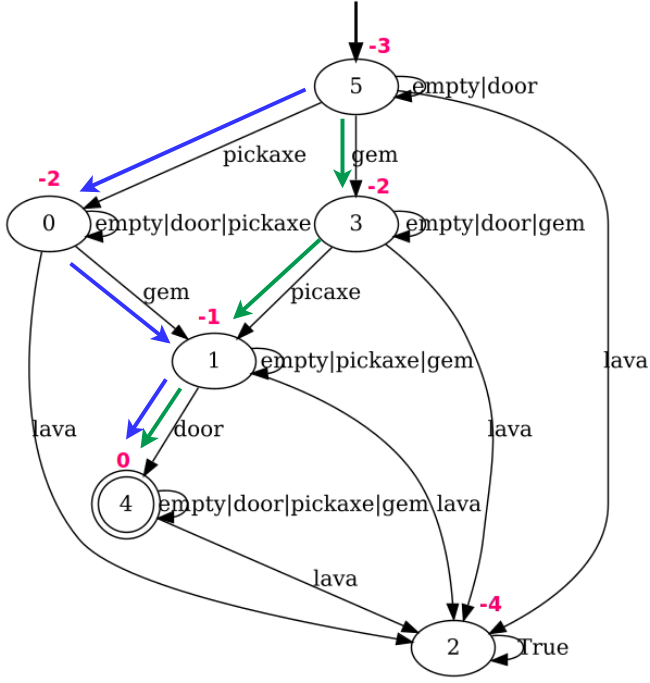
The image depicts a state transition diagram with six states represented as circles. Arrows indicate transitions between states, labeled with conditions or actions that trigger the transitions. Each transition also has a numerical value associated with it, likely representing a cost or reward. The states contain textual descriptions of their contents.
### Components/Axes
The diagram consists of:
* **States:** Six circular nodes labeled 0, 1, 2, 3, 4, and 5.
* **Transitions:** Arrows connecting the states, labeled with conditions (e.g., "pickaxe", "gem", "lava", "door") and numerical values (e.g., -2, -1, 0, -3, -4).
* **State Contents:** Each state contains a textual description of its contents, separated by the "|" character (e.g., "empty|door|pickaxe").
### Detailed Analysis or Content Details
**State 0:**
* Label: 0
* Contents: "empty|door|pickaxe"
* Transitions:
* To State 5: Labeled "pickaxe", value -2.
* To State 1: Labeled "gem", value -2.
* To State 4: Labeled "lava", value 0.
**State 1:**
* Label: 1
* Contents: "empty|pickaxe|gem"
* Transitions:
* To State 3: Labeled "pickaxe", value -1.
* To State 4: Labeled "door", value 0.
**State 2:**
* Label: 2
* Contents: "True"
* Transitions:
* From State 4: Labeled "lava", value -4.
**State 3:**
* Label: 3
* Contents: "empty|door|gem"
* Transitions:
* To State 5: Labeled "gem", value -2.
* To State 2: Labeled "lava", value 0.
**State 4:**
* Label: 4
* Contents: "empty|door|pickaxe|gem"
* Transitions:
* To State 2: Labeled "lava", value 0.
**State 5:**
* Label: 5
* Contents: "empty|door"
* Transitions:
* To State 3: Labeled "gem", value -3.
### Key Observations
* The diagram represents a system with six distinct states.
* Transitions are triggered by actions or conditions related to items like "pickaxe", "gem", "lava", and "door".
* The numerical values associated with transitions likely represent costs or rewards. Negative values suggest costs, while zero values might indicate neutral transitions.
* State 2 ("True") appears to be a terminal state, reachable from states 3 and 4.
* State 0 is the starting point, with transitions to multiple other states.
* The diagram is cyclical, with paths leading back to earlier states.
### Interpretation
This diagram likely models a game or a process where an agent navigates through different states by performing actions. The "empty", "door", "pickaxe", and "gem" elements likely represent items or conditions within the environment. The numerical values associated with transitions could represent the cost of performing an action or the reward gained.
The diagram suggests a path-finding or resource-management problem. The agent starts in State 0 and must navigate through the states, potentially collecting items ("pickaxe", "gem") and avoiding hazards ("lava") to reach the "True" state (State 2). The negative values on the transitions suggest that some actions are more costly than others.
The cyclical nature of the diagram indicates that the agent can revisit states, potentially creating loops or requiring strategic decision-making to avoid getting stuck. The presence of "lava" transitions leading to the "True" state from states 3 and 4 suggests that lava can be a path to success, or that the "True" state is a failure state.
The diagram is a concise representation of a complex system, allowing for analysis of possible paths, costs, and rewards. It could be used to optimize the agent's strategy for reaching the "True" state with minimal cost.