## Diagram: Multi-Level Optimization Process
### Overview
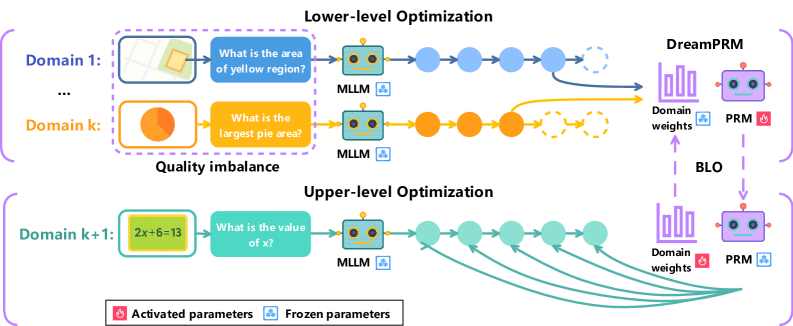
The image illustrates a multi-level optimization process, comprising a lower-level and an upper-level optimization. It depicts how different domains and their associated tasks are processed using Multi-Layer Language Models (MLLMs) and Parameter Recommendation Modules (PRMs), with a focus on domain weights and parameter activation/freezing.
### Components/Axes
* **Title:** Lower-level Optimization (top), Upper-level Optimization (bottom)
* **Domains:**
* Lower-level: Domain 1, ..., Domain k
* Upper-level: Domain k+1
* **Tasks:**
* Domain 1: "What is the area of yellow region?"
* Domain k: "What is the largest pie area?"
* Domain k+1: "What is the value of x?" (given the equation 2x+6=13)
* **Modules:** MLLM (Multi-Layer Language Model), PRM (Parameter Recommendation Module)
* **Processes:**
* Forward pass through MLLMs
* Domain weight adjustment
* Parameter activation/freezing
* **Legend:**
* Activated parameters (flame icon)
* Frozen parameters (snowflake icon)
* **Arrows:** Indicate the flow of information and processes.
* **BLO:** Bi-Level Optimization
### Detailed Analysis
* **Lower-level Optimization:**
* Starts with Domain 1, which includes an image with a yellow region. The task is "What is the area of yellow region?". This is processed by an MLLM. The output is represented by a series of blue circles, which eventually lead to DreamPRM.
* Domain k includes a pie chart. The task is "What is the largest pie area?". This is processed by an MLLM. The output is represented by a series of orange circles, which eventually lead to DreamPRM.
* The outputs from the MLLMs are fed into a "Domain weights" component within DreamPRM, which is represented by a bar graph.
* The PRM module is connected to the "Domain weights" component. The parameters of the PRM are marked as "Activated parameters" (flame icon).
* There is a "Quality imbalance" label between Domain k and Domain k+1.
* **Upper-level Optimization:**
* Starts with Domain k+1, which includes the equation "2x+6=13". The task is "What is the value of x?". This is processed by an MLLM. The output is represented by a series of teal circles, which eventually lead to a "Domain weights" component.
* The outputs from the MLLMs are fed into a "Domain weights" component, which is represented by a bar graph.
* The PRM module is connected to the "Domain weights" component. The parameters of the PRM are marked as "Frozen parameters" (snowflake icon).
* **Connections:**
* The "Domain weights" component in the lower-level optimization is connected to the "Domain weights" component in the upper-level optimization via a dashed arrow labeled "BLO".
* The PRM in the lower-level optimization is connected to the PRM in the upper-level optimization via a dashed arrow.
### Key Observations
* The diagram illustrates a hierarchical optimization process.
* The lower-level optimization deals with tasks related to image analysis and area calculation.
* The upper-level optimization deals with tasks related to equation solving.
* The MLLMs are used to process the tasks in each domain.
* The PRMs are used to recommend parameters based on the domain weights.
* The parameters of the PRM are activated in the lower-level optimization and frozen in the upper-level optimization.
* The BLO connects the domain weights between the lower and upper levels.
### Interpretation
The diagram represents a bi-level optimization strategy where the lower level focuses on processing diverse data types (images, charts) and the upper level handles symbolic reasoning (equation solving). The MLLMs extract relevant information from each domain, and the PRMs adjust parameters based on the learned domain weights. The BLO mechanism suggests a feedback loop or information transfer between the two levels, potentially allowing the system to adapt and improve its performance across different tasks. The "Quality imbalance" label suggests that the system is designed to handle variations in the quality or relevance of data from different domains. The activation/freezing of parameters in the PRM modules may indicate a strategy for transferring knowledge or preventing overfitting in specific tasks.