\n
## Diagram: Multi-Level Optimization Process
### Overview
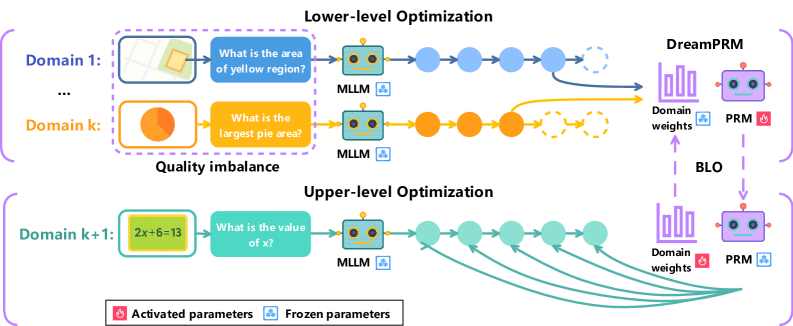
The image depicts a diagram illustrating a multi-level optimization process, likely within a machine learning or AI context. It showcases two levels of optimization: a lower-level optimization performed across multiple domains, and an upper-level optimization that adjusts domain weights. The diagram highlights the interaction between "MLLM" modules, "DreamPRM" components, and a "BLO" (likely a backloop optimization) process. The diagram also indicates which parameters are activated and frozen.
### Components/Axes
The diagram is structured into three main sections:
* **Lower-level Optimization:** This section shows optimization happening across multiple domains (Domain 1 to Domain k). Each domain has an input image and a question.
* **Quality Imbalance:** This section highlights the difference in quality between domains.
* **Upper-level Optimization:** This section shows the optimization of domain weights.
Key components include:
* **Domain 1…k:** Representing different data domains.
* **MLLM:** A module (likely Multi-modal Large Language Model) processing input images and questions.
* **DreamPRM:** A component receiving outputs from the lower-level optimization.
* **Domain weights:** Weights assigned to each domain.
* **BLO:** A backloop optimization process.
* **Activated parameters:** Represented by pink color.
* **Frozen parameters:** Represented by blue color.
### Detailed Analysis or Content Details
The diagram illustrates the flow of information and optimization signals.
**Lower-level Optimization:**
* **Domain 1:** Input is a grayscale image with a yellow square. The question is "What is the area of yellow region?". The output of the MLLM is passed through a series of circles (representing processing steps) to the DreamPRM. The connection is represented by a yellow arrow.
* **Domain k:** Input is a circular image with a pie chart. The question is "What is the largest pie area?". The output of the MLLM is passed through a series of circles to the DreamPRM. The connection is represented by an orange arrow.
* The diagram indicates a "Quality imbalance" between Domain 1 and Domain k.
**Upper-level Optimization:**
* **Domain k+1:** Input is an image with the equation "2x+6=13". The question is "What is the value of x?". The output of the MLLM is passed through a series of circles to the DreamPRM. The connection is represented by a series of green arrows.
* The DreamPRM receives input from the lower-level optimization and the upper-level optimization.
* The BLO connects the DreamPRM to the Domain weights.
* The Domain weights are then fed back into the lower-level optimization.
**Parameter Status:**
* The DreamPRM and PRM components have activated parameters (pink) and frozen parameters (blue).
* The activated parameters are located in the bottom-right corner of the DreamPRM and PRM components.
### Key Observations
* The diagram highlights a two-level optimization process, suggesting a hierarchical approach to learning or adaptation.
* The "Quality imbalance" suggests that different domains may have varying levels of difficulty or data quality.
* The BLO indicates a feedback loop, allowing the system to refine its domain weights based on performance.
* The distinction between activated and frozen parameters suggests a fine-tuning or transfer learning strategy.
### Interpretation
The diagram illustrates a system designed to optimize performance across multiple data domains. The lower-level optimization focuses on solving tasks within each domain, while the upper-level optimization adjusts the importance (weights) of each domain. The BLO provides a mechanism for continuous improvement by feeding back performance information. The quality imbalance suggests that the system is aware of the varying difficulty of different domains and may be attempting to compensate for this. The use of activated and frozen parameters suggests that the system is leveraging pre-trained knowledge (frozen parameters) while adapting to specific domains (activated parameters).
The diagram suggests a sophisticated approach to multi-domain learning, potentially addressing challenges such as domain adaptation and transfer learning. The system appears to be designed to learn from diverse data sources and optimize performance based on the specific characteristics of each domain. The overall architecture suggests a focus on robustness and adaptability. The diagram does not provide any numerical data or specific performance metrics, but it offers a clear conceptual overview of the optimization process.