## Diagram: Multi-stage Optimization Pipeline with Domain-Specific Processing
### Overview
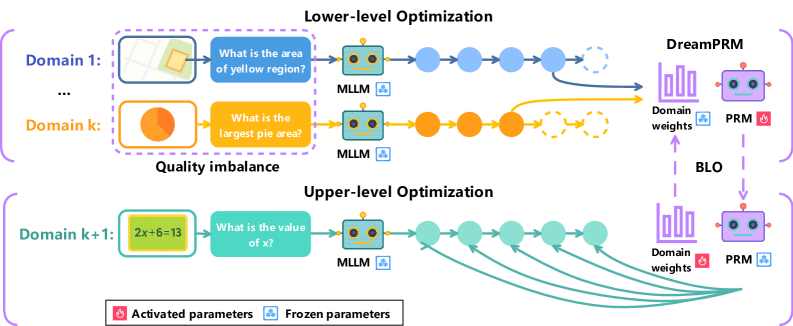
The diagram illustrates a hierarchical optimization framework combining domain-specific processing (Lower-level Optimization) and global optimization (Upper-level Optimization). It features color-coded components, directional flows, and parameter management systems (activated/frozen parameters). The architecture integrates multiple domains, mathematical reasoning, and optimization models (DreamPRM, BLO).
### Components/Axes
1. **Lower-level Optimization Section (Top)**
- **Domains**:
- Domain 1: Map visualization with yellow region area question
- Domain k: Pie chart with "largest pie area" question
- **MLLM Processing**:
- Blue nodes (Domain 1) and orange nodes (Domain k) represent MLLM processing steps
- Arrows show sequential processing flow
- **Output**:
- Connects to DreamPRM (purple) and BLO (yellow) optimization models
2. **Upper-level Optimization Section (Bottom)**
- **Domain k+1**:
- Mathematical equation "2x+6=13" with "What is the value of x?" question
- **MLLM Processing**:
- Green nodes represent MLLM processing for mathematical reasoning
- Multiple arrows indicate parallel processing paths
- **Output**:
- Connects to DreamPRM and BLO through domain weights
3. **Parameter Management**
- **Activated Parameters**: Red flame icon (bottom-left)
- **Frozen Parameters**: Blue snowflake icon (bottom-left)
- **Legend**:
- Positioned at bottom-center
- Color coding:
- Blue = Domain 1 processing
- Orange = Domain k processing
- Green = Domain k+1 processing
- Purple = DreamPRM
- Yellow = BLO
- Red = Activated parameters
- Blue = Frozen parameters
### Detailed Analysis
1. **Domain Processing Flow**
- Lower-level domains (1 to k) process visual/spatial tasks (maps, pie charts)
- Upper-level domain (k+1) handles mathematical reasoning
- All domains feed into MLLM processing nodes before optimization
2. **Color-Coded Connections**
- Blue arrows: Domain 1 → MLLM → DreamPRM
- Orange arrows: Domain k → MLLM → BLO
- Green arrows: Domain k+1 → MLLM → DreamPRM/BLO
- Purple arrows: Domain weights → DreamPRM
- Yellow arrows: Domain weights → BLO
3. **Optimization Models**
- **DreamPRM**:
- Receives inputs from all domains
- Connected to purple domain weights
- **BLO**:
- Receives inputs from Domain k and k+1
- Connected to yellow domain weights
### Key Observations
1. **Quality Imbalance**:
- Lower-level domains show visual tasks with varying complexity (map vs. pie chart)
- Upper-level domain demonstrates mathematical reasoning capability
2. **Parameter Management**:
- Red (activated) and blue (frozen) parameters suggest dynamic model adaptation
- Frozen parameters likely maintain core functionality while activated parameters enable domain-specific adjustments
3. **Multi-path Optimization**:
- Domain k+1 connects to both DreamPRM and BLO through multiple green arrows
- Suggests parallel optimization pathways for different objective functions
### Interpretation
This diagram represents a sophisticated optimization system that:
1. Processes domain-specific tasks through specialized MLLM modules
2. Maintains parameter flexibility through activation/freezing mechanisms
3. Combines local optimizations (DreamPRM) with global balancing (BLO)
4. Handles both visual/spatial and mathematical reasoning tasks
The color-coded architecture suggests a modular design where:
- Different colors represent distinct processing streams
- Arrows indicate information flow and optimization dependencies
- Domain weights (purple/yellow) likely represent importance/confidence metrics
The presence of both visual and mathematical domains implies the system can handle multimodal optimization challenges, with the Upper-level optimization serving as a meta-controller that coordinates domain-specific optimizations while maintaining overall system coherence.