## Bar Chart: Idle Cycles vs. Prompt and Output Length
### Overview
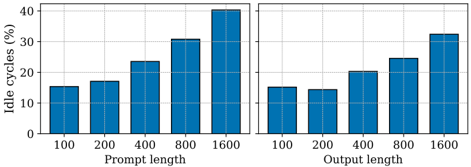
The image contains a dual-panel bar chart comparing idle cycles (in percentage) against two variables: **prompt length** (left panel) and **output length** (right panel). Both panels use identical axes and color schemes, with blue bars representing data points. The x-axes categorize values in powers of two (100, 200, 400, 800, 1600), while the y-axis scales from 0% to 40% in 10% increments.
---
### Components/Axes
- **Y-Axis**: Labeled "Idle cycles (%)", ranging from 0% to 40%.
- **X-Axes**:
- Left Panel: "Prompt length" with categories: 100, 200, 400, 800, 1600.
- Right Panel: "Output length" with identical categories.
- **Bars**: All bars are blue, with no legend or color differentiation.
- **Gridlines**: Light gray horizontal and vertical lines for reference.
---
### Detailed Analysis
#### Left Panel (Prompt Length)
- **100**: ~15% idle cycles.
- **200**: ~17% idle cycles.
- **400**: ~23% idle cycles.
- **800**: ~31% idle cycles.
- **1600**: ~40% idle cycles.
#### Right Panel (Output Length)
- **100**: ~15% idle cycles.
- **200**: ~14% idle cycles.
- **400**: ~20% idle cycles.
- **800**: ~24% idle cycles.
- **1600**: ~32% idle cycles.
---
### Key Observations
1. **Upward Trend**: Both panels show a general increase in idle cycles as prompt/output length increases.
2. **Steeper Growth in Prompt Length**: The left panel exhibits a sharper rise, particularly between 800 and 1600 (31% → 40%).
3. **Output Length Dip**: The right panel shows a minor decline at 200 (15% → 14%) before resuming growth.
4. **Asymmetry**: Prompt length consistently exceeds output length at equivalent scales (e.g., 1600 prompt length = 40% vs. 1600 output length = 32%).
---
### Interpretation
The data suggests that **longer prompts have a disproportionately higher impact on idle cycles compared to output length**. The steeper slope in the prompt length panel implies that processing longer input sequences consumes significantly more system resources. The slight dip at 200 in the output length panel may indicate an optimization or anomaly in shorter output processing. These trends could reflect computational bottlenecks in handling longer sequences, such as memory allocation or parallelization inefficiencies. The absence of a legend or color coding limits granular analysis but confirms uniformity in measurement methodology.