## Line Graphs: Original vs. Balanced kv-norm Values
### Overview
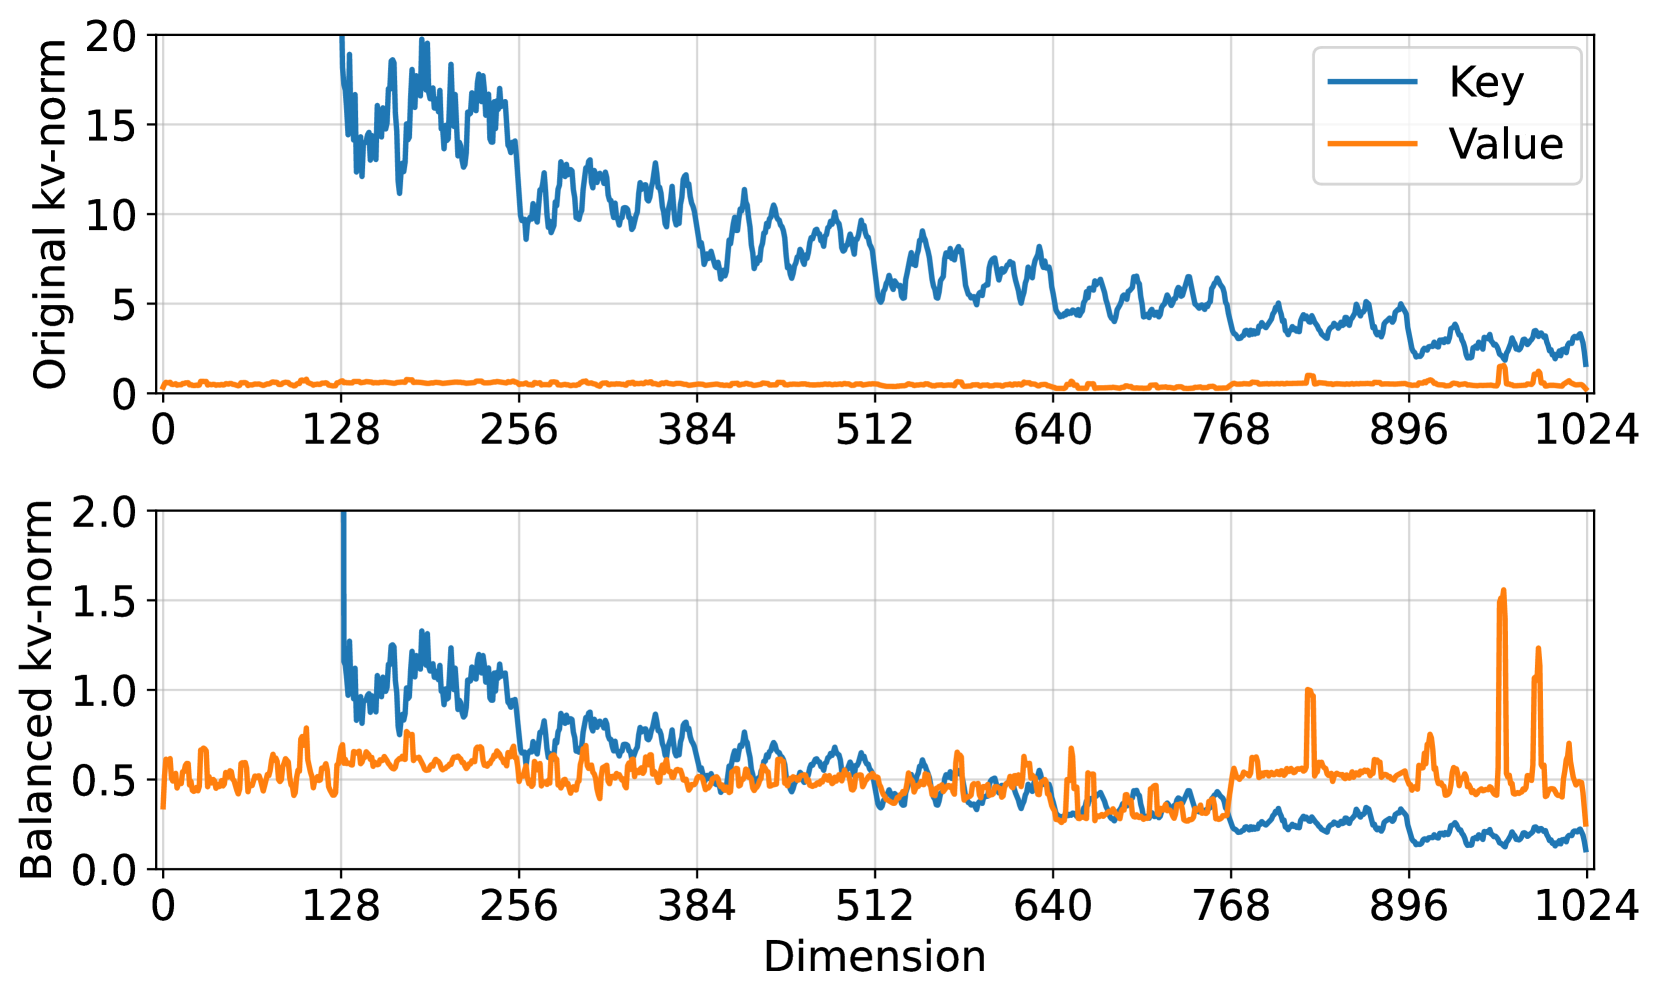
The image contains two vertically stacked line graphs comparing "Key" (blue) and "Value" (orange) metrics across dimensions 0–1024. The top graph shows "Original kv-norm" values, while the bottom graph displays "Balanced kv-norm" values. Both graphs use logarithmic scaling on the x-axis (Dimension) and linear scaling on the y-axis (kv-norm).
### Components/Axes
- **X-axis (Dimension)**:
- Labels: 0, 128, 256, 384, 512, 640, 768, 896, 1024
- Scale: Linear increments of 128
- **Y-axis (Top Graph - Original kv-norm)**:
- Range: 0–20
- Labels: 0, 5, 10, 15, 20
- **Y-axis (Bottom Graph - Balanced kv-norm)**:
- Range: 0–2.0
- Labels: 0, 0.5, 1.0, 1.5, 2.0
- **Legend**:
- Position: Top-right corner of the top graph
- Labels:
- Blue line = "Key"
- Orange line = "Value"
### Detailed Analysis
#### Top Graph (Original kv-norm)
- **Key (Blue Line)**:
- Starts at ~18 at dimension 0, spikes to ~20 at dimension 128, then declines sharply to ~5 by dimension 256.
- Fluctuates between ~3–10 between dimensions 256–1024, with minor peaks (e.g., ~8 at 512, ~6 at 768).
- **Value (Orange Line)**:
- Remains nearly flat at ~0.2 across all dimensions, with minor noise (<0.1 variation).
#### Bottom Graph (Balanced kv-norm)
- **Key (Blue Line)**:
- Starts at ~1.8 at dimension 0, spikes to ~2.0 at dimension 128, then declines to ~0.5 by dimension 256.
- Fluctuates between ~0.2–0.8 between dimensions 256–1024, with a notable peak (~1.2) at dimension 896.
- **Value (Orange Line)**:
- Starts at ~0.5 at dimension 0, rises to ~0.7 at dimension 128, then stabilizes between ~0.4–0.6 until dimension 768.
- Shows sharp spikes (~1.5 at 896 and ~1.2 at 1024), exceeding Key values in these regions.
### Key Observations
1. **Original vs. Balanced Disparity**:
- In the original graph, Key values are orders of magnitude higher than Value (e.g., 18 vs. 0.2 at dimension 0).
- Balancing reduces this gap (e.g., 1.8 vs. 0.5 at dimension 0), but Value retains higher variability in later dimensions.
2. **Spike at Dimension 128**:
- Both graphs show a pronounced spike in Key values at dimension 128 (~20 in original, ~2.0 in balanced), suggesting a localized anomaly or outlier.
3. **Value Spikes in Balanced Graph**:
- Value exhibits unexpected peaks at dimensions 896 and 1024 (~1.5 and ~1.2, respectively), which are absent in the original graph.
### Interpretation
- **Normalization Impact**: The "Balanced kv-norm" graph demonstrates that scaling reduces Key-Value disparities, but Value retains higher relative variability in later dimensions.
- **Anomaly at 128**: The consistent spike in Key values at dimension 128 across both graphs suggests a systemic issue (e.g., data corruption, outlier event) requiring investigation.
- **Value Behavior**: The late-stage spikes in Value (896–1024) in the balanced graph may indicate unaddressed imbalances or secondary factors affecting Value metrics post-normalization.
*Note: All values are approximate due to the absence of gridlines or exact numerical annotations.*