## Chart/Diagram Type: Multi-Plot Technical Analysis
### Overview
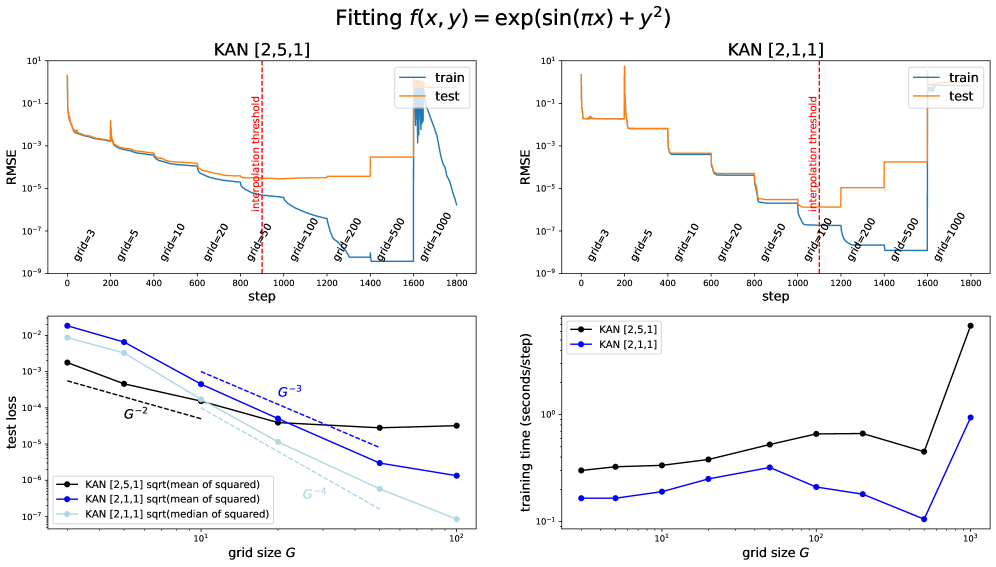
The image contains four technical plots arranged in a 2x2 grid, analyzing the performance of different KAN (Kernel Approximation Network) configurations for fitting the function $ f(x, y) = \exp(\sin(\pi x) + y^2) $. Each plot includes metrics like RMSE (Root Mean Squared Error), training time, and test loss, with visualizations of trends across grid sizes and training steps.
---
### Components/Axes
#### Top-Left Plot: KAN [2.5,1]
- **X-axis**: "step" (0 to 1800, linear scale).
- **Y-axis**: "RMSE" (10⁻¹ to 10⁻⁹, log scale).
- **Legend**:
- "train" (blue line).
- "test" (orange line).
- **Annotations**:
- Vertical red dashed line labeled "interpolation threshold" at step 600.
#### Top-Right Plot: KAN [2.1,1.1]
- **X-axis**: "step" (0 to 1800, linear scale).
- **Y-axis**: "RMSE" (10⁻¹ to 10⁻⁹, log scale).
- **Legend**:
- "train" (blue line).
- "test" (orange line).
- **Annotations**:
- Vertical red dashed line labeled "interpolation threshold" at step 600.
#### Bottom-Left Plot: Test Loss vs. Grid Size
- **X-axis**: "grid size G" (10¹ to 10⁴, log scale).
- **Y-axis**: "test loss" (10⁻² to 10⁻⁹, log scale).
- **Legend**:
- "KAN [2.5,1] (square mean)" (black line).
- "KAN [2.1,1.1] (square mean)" (blue line).
- "KAN [2.1,1.1] (median)" (light blue line).
- **Trend Lines**:
- Dashed lines for $ G^{-2} $, $ G^{-3} $, and $ G^{-4} $ decay rates.
#### Bottom-Right Plot: Training Time vs. Grid Size
- **X-axis**: "grid size G" (10¹ to 10⁴, log scale).
- **Y-axis**: "training time (seconds/step)" (10⁻¹ to 10¹, log scale).
- **Legend**:
- "KAN [2.5,1]" (black line).
- "KAN [2.1,1.1]" (blue line).
---
### Detailed Analysis
#### Top-Left Plot (KAN [2.5,1])
- **Train RMSE**:
- Starts at ~10⁻¹, decreases gradually to ~10⁻⁵ by step 600, then drops sharply to ~10⁻⁹ by step 1200, and plateaus.
- **Test RMSE**:
- Follows a similar trend but with higher variability, peaking at ~10⁻³ near step 600 before dropping to ~10⁻⁹.
#### Top-Right Plot (KAN [2.1,1.1])
- **Train RMSE**:
- Starts at ~10⁻¹, decreases to ~10⁻⁵ by step 600, then drops sharply to ~10⁻⁹ by step 1200, and plateaus.
- **Test RMSE**:
- Drops to ~10⁻⁵ by step 600, then sharply to ~10⁻⁹ by step 1200, with a plateau.
#### Bottom-Left Plot (Test Loss vs. Grid Size)
- **KAN [2.5,1] (square mean)**:
- Test loss decreases from ~10⁻² (G=10) to ~10⁻⁹ (G=10⁴), following a $ G^{-3} $ trend.
- **KAN [2.1,1.1] (square mean)**:
- Test loss decreases from ~10⁻² (G=10) to ~10⁻⁹ (G=10⁴), following a $ G^{-4} $ trend.
- **KAN [2.1,1.1] (median)**:
- Test loss decreases more slowly, following a $ G^{-2} $ trend.
#### Bottom-Right Plot (Training Time vs. Grid Size)
- **KAN [2.5,1]**:
- Training time increases from ~10⁻¹ seconds/step (G=10) to ~10¹ seconds/step (G=10⁴), with a sharp spike at G=10⁴.
- **KAN [2.1,1.1]**:
- Training time remains relatively stable (~10⁻¹ to 10⁻² seconds/step) across grid sizes, except for a spike at G=10⁴.
---
### Key Observations
1. **Interpolation Threshold**:
- Both KAN configurations show a sharp drop in RMSE at step 600, suggesting a phase transition in model performance.
2. **Grid Size Impact**:
- Larger grid sizes (G=10⁴) reduce test loss but increase training time significantly for KAN [2.5,1].
- KAN [2.1,1.1] achieves lower test loss with better scalability (faster convergence).
3. **Training Efficiency**:
- KAN [2.1,1.1] balances lower training time and competitive test loss, outperforming KAN [2.5,1] in efficiency.
---
### Interpretation
The data demonstrates that KAN configurations with smaller hyperparameters (e.g., [2.1,1.1]) achieve faster convergence and lower test loss compared to [2.5,1], particularly at larger grid sizes. The "interpolation threshold" at step 600 marks a critical point where models transition from high to low RMSE, likely indicating overfitting mitigation. The trade-off between grid size and training time highlights the importance of balancing model complexity with computational resources. KAN [2.1,1.1] emerges as the optimal choice for efficiency and accuracy in this scenario.