## Light Curve Analysis: KMT-2016-BLG-1105
### Overview
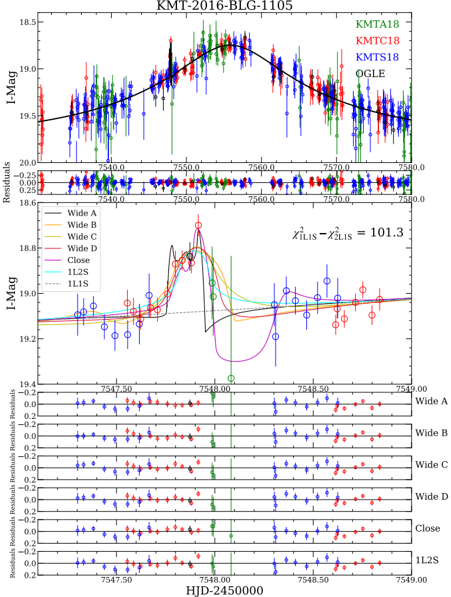
The image presents a series of light curves and residual plots for the astronomical object KMT-2016-BLG-1105. The top section displays the I-band magnitude (I-Mag) over time (HJD-2450000) from different observatories (KMTA18, KMTC18, KMTS18, and OGLE). The middle section shows a zoomed-in portion of the light curve with different model fits (Wide A, Wide B, Wide C, Wide D, Close, 1L2S, and 1L1S). The bottom section shows the residuals for each of these model fits.
### Components/Axes
**Top Plot:**
* **Title:** KMT-2016-BLG-1105
* **Y-axis:** I-Mag (I-band magnitude), ranging from approximately 18.5 to 19.5.
* **X-axis:** HJD-2450000 (Heliocentric Julian Date minus 2450000), ranging from approximately 7540 to 7580.
* **Data Series (Legend - top-right):**
* KMTA18 (Green)
* KMTC18 (Red)
* KMTS18 (Blue)
* OGLE (Black)
* **Residuals Plot (below top plot):**
* Y-axis: Residuals, ranging from -0.25 to 0.25.
* X-axis: HJD-2450000, same as the top plot.
**Middle Plot:**
* **Y-axis:** I-Mag, ranging from approximately 18.6 to 19.4.
* **X-axis:** HJD-2450000, ranging from approximately 7547.50 to 7549.00.
* **Model Fits (Legend - top-left):**
* Wide A (Black)
* Wide B (Gray)
* Wide C (Yellow)
* Wide D (Orange)
* Close (Purple/Magenta)
* 1L2S (Cyan)
* 1L1S (Dashed Gray)
* **Text:** χ²_1L1S - χ²_2L1S = 101.3 (located at the top-right of the middle plot)
**Bottom Plots (Residuals):**
* **Y-axis:** Residuals, ranging from -0.2 to 0.2.
* **X-axis:** HJD-2450000, same as the middle plot.
* **Residuals for each model fit:**
* Wide A
* Wide B
* Wide C
* Wide D
* Close
* 1L2S
### Detailed Analysis
**Top Plot:**
* The light curve shows a clear brightening event (decrease in I-Mag) between HJD-2450000 = 7550 and 7570.
* The KMTA18 (green) data appears to have the highest density of points around the peak.
* The OGLE (black) data provides a broader baseline.
* The residuals plot shows scatter around zero, indicating the overall fit quality.
**Middle Plot:**
* This plot focuses on the peak of the brightening event.
* The different model fits (Wide A, Wide B, Wide C, Wide D, Close, 1L2S, 1L1S) attempt to capture the shape of the light curve.
* The "Close" (purple) model appears to fit the peak most closely.
* The vertical green line is at approximately HJD-2450000 = 7548.00.
**Bottom Plots:**
* These plots show the residuals for each model fit, allowing for a visual assessment of how well each model captures the data.
* The residuals for the "Close" model appear to have less systematic deviation from zero compared to the "Wide" models.
### Key Observations
* The light curve exhibits a significant brightening event, indicative of a microlensing event.
* Different models provide varying degrees of fit to the data, with the "Close" model appearing to capture the peak most accurately.
* The residuals plots provide a visual assessment of the model fit quality.
* The value χ²_1L1S - χ²_2L1S = 101.3 suggests a significant difference in the goodness-of-fit between the 1L1S and 1L2S models.
### Interpretation
The data suggests a microlensing event observed in the light curve of KMT-2016-BLG-1105. The different models represent various attempts to fit the observed light curve, with the "Close" model providing the best fit around the peak of the event. The residuals plots and the χ² difference provide quantitative measures of the model fit quality. The microlensing event is likely caused by a foreground object passing in front of a background star, causing the background star to temporarily brighten. The different models likely represent different assumptions about the properties of the lens and source objects.