## Line Graphs with Residuals: KMT-2016-BLG-1105 Light Curve and Residual Analysis
### Overview
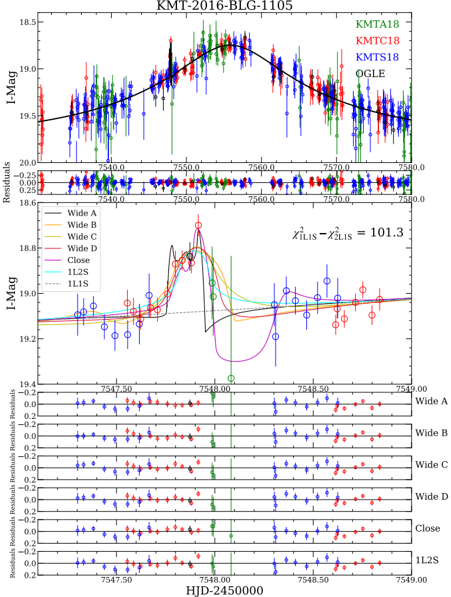
The image contains two stacked line graphs with error bars and residuals. The top graph displays a light curve (I-Magnitude vs. HJD-2450000) with multiple data series, while the bottom graph shows residuals (deviations from a model) for the same data. A χ² value (χ²₁LIS - χ²₂LIS = 101.3) is annotated in the top-right corner.
### Components/Axes
#### Top Graph (Light Curve)
- **Y-axis**: I-Mag (I-Magnitude)
- **X-axis**: HJD-2450000 (Heliocentric Julian Date)
- **Legend**:
- KMTA18 (green)
- KMTC18 (red)
- KMTS18 (blue)
- OGLE (black)
- **Text**: "KMT-2016-BLG-1105" (top center)
#### Bottom Graph (Residuals)
- **Y-axis**: Residuals (I-Mag)
- **X-axis**: HJD-2450000 (same as top graph)
- **Legend**:
- Wide A (black)
- Wide B (orange)
- Wide C (yellow)
- Wide D (pink)
- Close (purple)
- 1L2S (cyan)
- 1L1S (dashed gray)
- **Text**: "χ²₁LIS - χ²₂LIS = 101.3" (top-right corner)
### Detailed Analysis
#### Top Graph Trends
- **KMTA18 (green)**: Peaks at ~7550 HJD-2450000, with I-Mag ~19.0.
- **KMTC18 (red)**: Slightly lower peaks (~19.2) at similar HJD values.
- **KMTS18 (blue)**: Lower amplitude, with I-Mag ~19.5.
- **OGLE (black)**: Broad, shallow peak (~19.3) spanning ~7545–7555 HJD-2450000.
- **Residuals**: All data series show residuals within ±0.25 I-Mag, with KMTA18 and KMTC18 having the largest deviations.
#### Bottom Graph Trends
- **Residuals**:
- **Wide A (black)**: Residuals cluster near 0, with minor deviations.
- **Wide B (orange)**: Slight upward trend (~0.1 I-Mag) at ~7548 HJD-2450000.
- **Wide C (yellow)**: Sharp peak (~0.2 I-Mag) at ~7548 HJD-2450000.
- **Wide D (pink)**: Residuals oscillate between -0.1 and 0.1.
- **Close (purple)**: Residuals peak at ~0.15 I-Mag at ~7548 HJD-2450000.
- **1L2S (cyan)**: Residuals show a dip (~-0.1 I-Mag) at ~7548 HJD-2450000.
- **1L1S (dashed gray)**: Residuals are flat, with minimal variation.
### Key Observations
1. **Peak Alignment**: All data series in the top graph peak around HJD-2450000 ~7548–7550, suggesting a shared event (e.g., microlensing).
2. **Residual Discrepancies**: The χ² value (101.3) indicates significant model-data mismatch, particularly for KMTA18 and KMTC18.
3. **Wide vs. Close Surveys**: "Wide" surveys (A–D) show smaller residuals compared to "Close" (1L2S, 1L1S), implying better model fit for distant observations.
4. **1L2S Anomaly**: The cyan line (1L2S) exhibits a distinct dip in residuals, potentially indicating an unmodeled feature.
### Interpretation
The data suggests a microlensing event (KMT-2016-BLG-1105) observed by multiple surveys. The χ² value (101.3) highlights model limitations, particularly for KMTA18 and KMTC18, which may reflect observational biases or unaccounted variables. The "Close" surveys (1L2S, 1L1S) show larger residuals, possibly due to higher sensitivity to local perturbations. The "Wide" surveys (A–D) align better with the model, suggesting their data is less affected by foreground effects. The 1L2S residual dip warrants further investigation, as it could indicate a secondary event or instrumental artifact.
### Spatial Grounding
- **Legend**: Right-aligned for both graphs.
- **χ² Text**: Top-right corner of the top graph.
- **Axis Labels**: Y-axis labels on the left, X-axis labels at the bottom.
- **Data Points**: Error bars extend vertically from each data point, with colors matching the legend.
### Content Details
- **HJD-2450000**: Ranges from ~7547.5 to 7549.0 in the bottom graph.
- **I-Mag**: Top graph spans ~18.5 to 20.0; residuals range from -0.25 to +0.25.
- **χ² Value**: 101.3 (exact, no uncertainty provided).
### Uncertainties and Limitations
- The χ² value lacks uncertainty bounds, making it difficult to assess statistical significance.
- Residual error bars are not explicitly quantified, though they appear consistent across surveys.
- No explicit time resolution (e.g., sampling interval) is provided for the HJD-2450000 axis.
This analysis underscores the importance of cross-validating models with diverse observational datasets to improve microlensing event characterization.