## Line Graphs: Model Performance Across Draft Lengths
### Overview
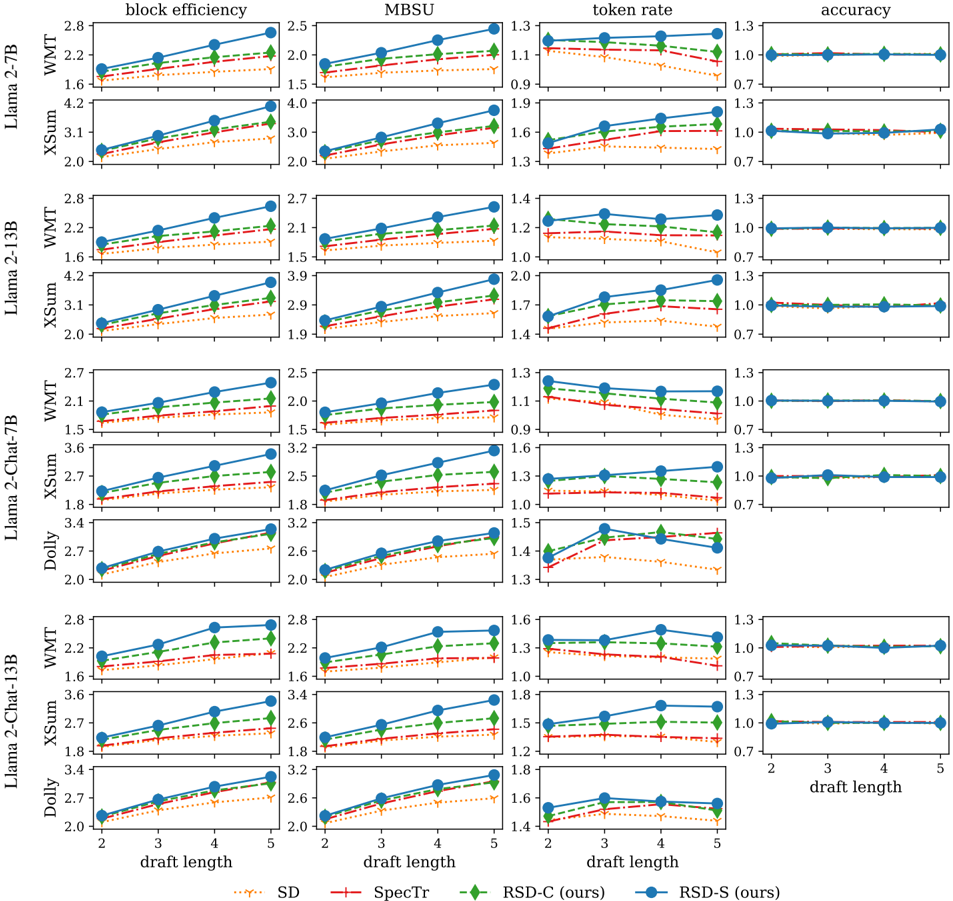
The image contains multiple line graphs comparing the performance of different language models (SD, SpecTr, RSD-C, RSD-S) across three metrics: **block efficiency**, **token rate**, and **accuracy**. Each graph corresponds to a specific model architecture (e.g., Llama-2-7B, Llama-2-13B, XSum, Dolly, Llama-2-Chat-13B) and evaluates how performance changes as draft length increases from 2 to 5. The graphs use distinct line styles and colors to differentiate models, with a legend at the bottom for reference.
---
### Components/Axes
- **X-axis**: Draft length (2–5), labeled as "draft length" in all graphs.
- **Y-axes**:
- **Block efficiency**: Y-axis ranges from ~1.5 to 2.8.
- **Token rate**: Y-axis ranges from ~0.7 to 1.6.
- **Accuracy**: Y-axis ranges from ~0.7 to 1.3.
- **Legends**:
- **SD**: Orange dotted line.
- **SpecTr**: Red dashed line.
- **RSD-C (ours)**: Green dashed line.
- **RSD-S (ours)**: Blue solid line.
- **Model categories** (grouped by architecture):
- Llama-2-7B
- Llama-2-13B
- XSum
- Dolly
- Llama-2-Chat-13B
---
### Detailed Analysis
#### Block Efficiency
- **Trend**: RSD-S (blue) consistently shows the highest block efficiency, increasing slightly with draft length (e.g., 2.2 → 2.8 for Llama-2-7B). SD (orange) and SpecTr (red) decline marginally, while RSD-C (green) remains stable.
- **Data points**:
- Llama-2-7B: RSD-S (2.2 → 2.8), SpecTr (1.6 → 1.8), RSD-C (1.4 → 1.6), SD (1.2 → 1.4).
- Llama-2-13B: RSD-S (2.0 → 2.6), SpecTr (1.8 → 2.0), RSD-C (1.6 → 1.8), SD (1.4 → 1.6).
#### Token Rate
- **Trend**: RSD-S (blue) increases with draft length (e.g., 1.3 → 1.6 for Llama-2-7B), while SD (orange) and SpecTr (red) decline. RSD-C (green) remains flat.
- **Data points**:
- Llama-2-7B: RSD-S (1.3 → 1.6), SpecTr (1.1 → 0.9), RSD-C (1.2 → 1.2), SD (1.4 → 1.1).
- XSum: RSD-S (1.7 → 2.0), SpecTr (1.5 → 1.3), RSD-C (1.4 → 1.4), SD (1.9 → 1.6).
#### Accuracy
- **Trend**: All models maintain stable accuracy (~0.7–1.0) across draft lengths, with minor fluctuations. RSD-S (blue) and RSD-C (green) show slight improvements in some cases.
- **Data points**:
- Llama-2-7B: RSD-S (0.7 → 0.7), SpecTr (0.7 → 0.7), RSD-C (0.7 → 0.7), SD (0.7 → 0.7).
- Dolly: RSD-S (0.7 → 0.7), SpecTr (0.7 → 0.7), RSD-C (0.7 → 0.7), SD (0.7 → 0.7).
---
### Key Observations
1. **RSD-S (blue)** outperforms other models in **block efficiency** and **token rate** for most architectures, especially at longer draft lengths.
2. **SD (orange)** and **SpecTr (red)** exhibit declining performance in token rate as draft length increases.
3. **Accuracy** remains largely unaffected by draft length across all models, suggesting robustness in output quality.
4. **RSD-C (green)** maintains consistent performance but lags behind RSD-S in efficiency metrics.
---
### Interpretation
The data suggests that **RSD-S** is optimized for efficiency (block efficiency and token rate) at the cost of slightly higher computational demands, as indicated by its rising performance with longer drafts. In contrast, **SD** and **SpecTr** degrade in efficiency under similar conditions, potentially due to suboptimal scaling. The stability of accuracy across draft lengths implies that longer drafts do not inherently compromise output quality, but efficiency gains depend heavily on model architecture. Notably, **RSD-C** balances performance and efficiency but does not surpass RSD-S in critical metrics. These trends highlight the importance of architectural design in scaling language models effectively.