TECHNICAL ASSET FINGERPRINT
37c27732e3ce8a8ebcdf23ea
Click to view fullscreen
Press ESC or click to close
FOUND IN PAPERS
EXPERT: healer-alpha-free VERSION 1
RUNTIME: free/openrouter/healer-alpha
INTEL_VERIFIED
## Diagram: Blocksworld Task Planning with Expert vs. Amateur Logits
### Overview
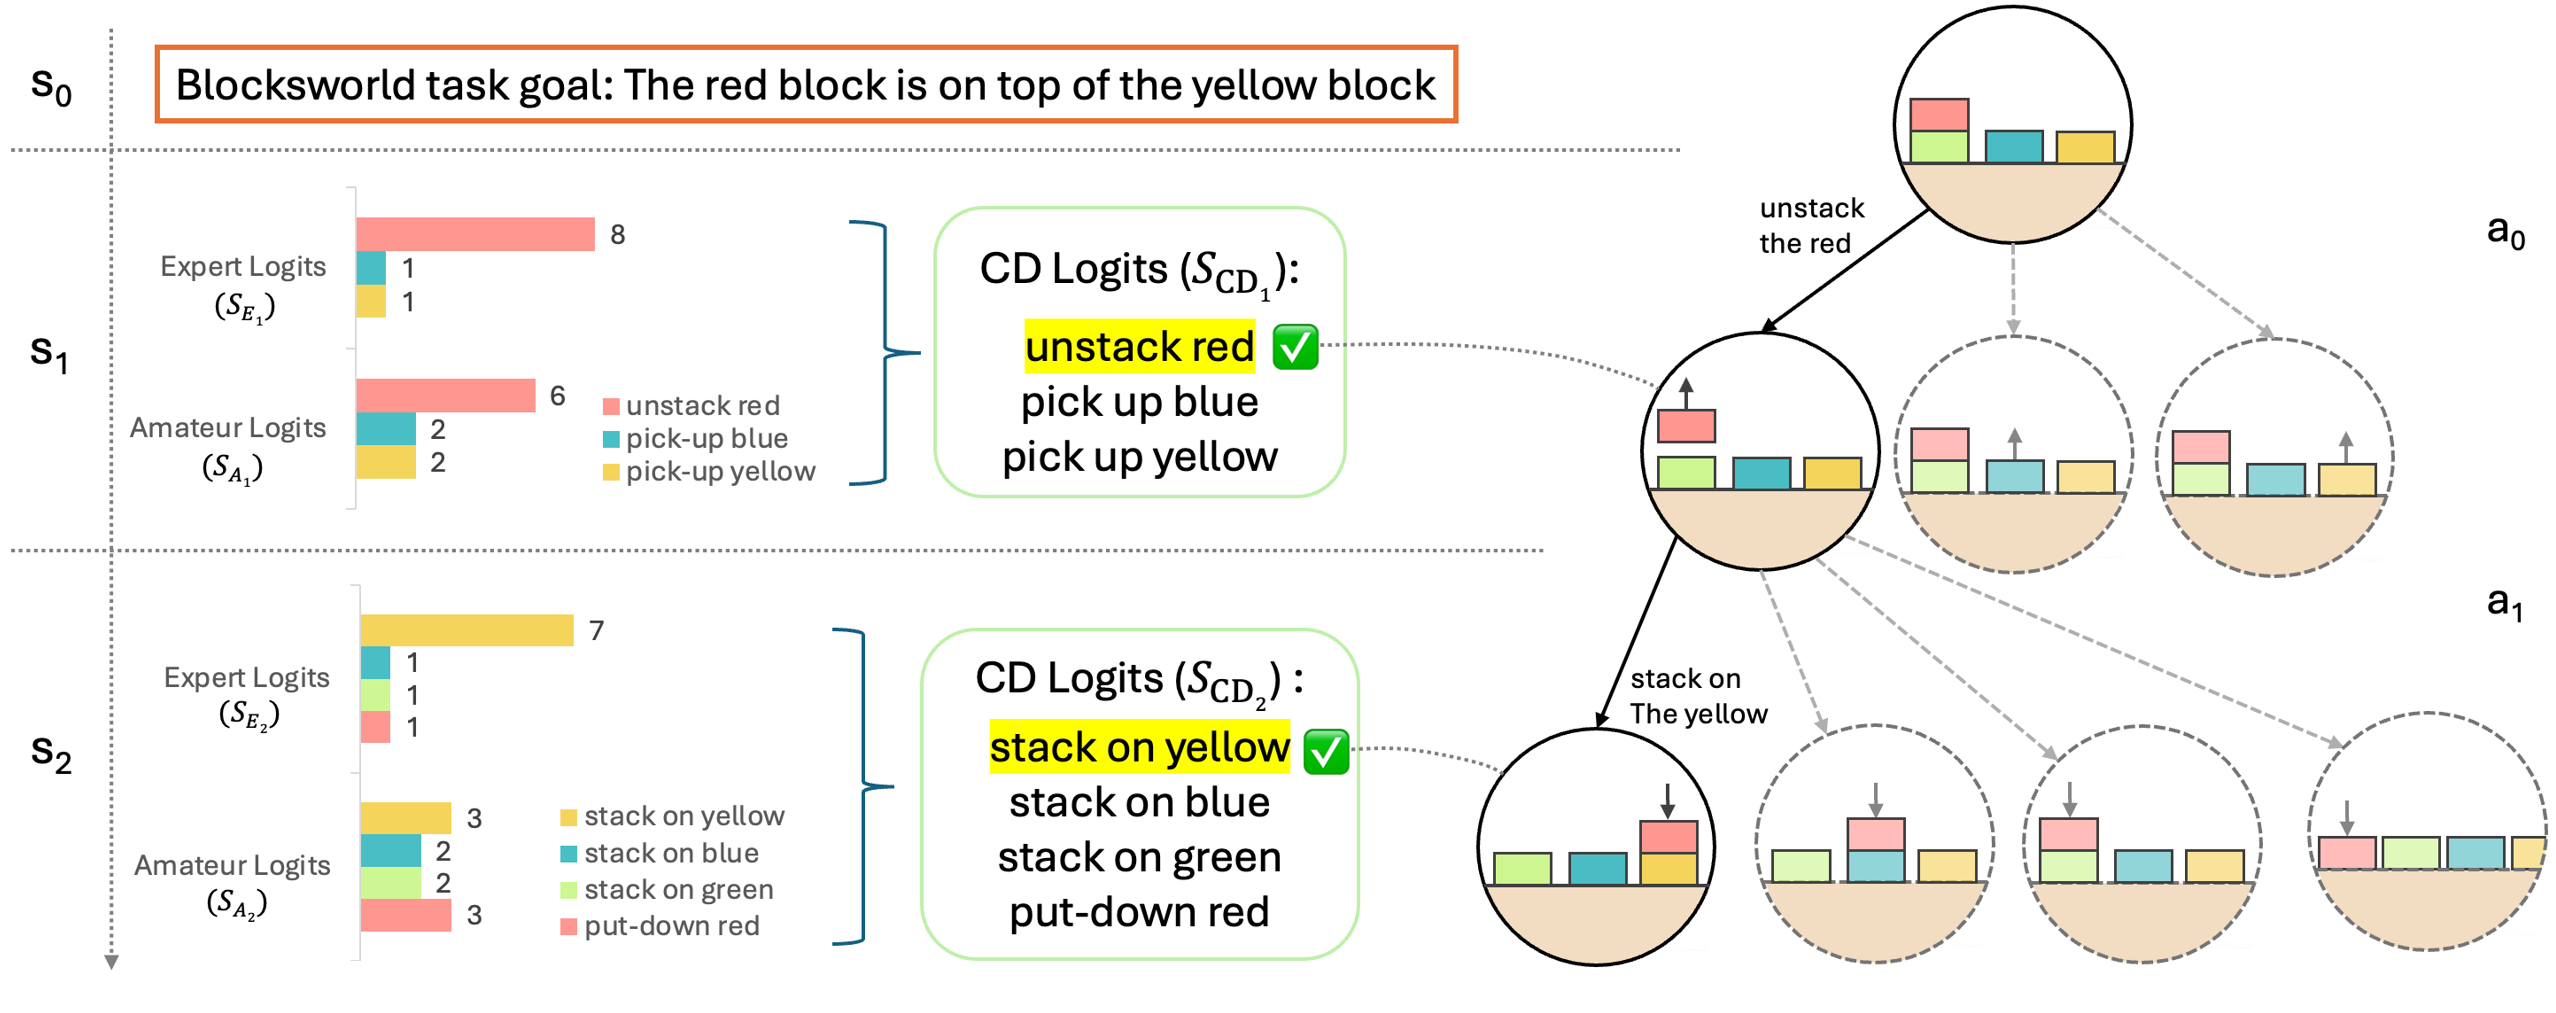
This image is a technical diagram illustrating a two-step planning process in a "Blocksworld" domain. It compares the decision-making (logits) of an "Expert" model and an "Amateur" model at two sequential states (S₁ and S₂) to achieve a stated goal. The diagram combines bar charts for numerical logits, text boxes for action selection, and circular state diagrams to visualize the physical block configurations and action outcomes.
### Components/Axes
**1. Header (S₀):**
* **Text:** "Blocksworld task goal: The red block is on top of the yellow block" (enclosed in an orange box).
* **State Label:** `S₀` (top-left).
**2. State S₁ Section:**
* **Left - Bar Charts:**
* **Expert Logits (S<sub>E₁</sub>):** Horizontal bars with values.
* Red bar: `8` (Label: `unstack red` from legend)
* Blue bar: `1` (Label: `pick-up blue` from legend)
* Yellow bar: `1` (Label: `pick-up yellow` from legend)
* **Amateur Logits (S<sub>A₁</sub>):** Horizontal bars with values.
* Red bar: `6` (Label: `unstack red`)
* Blue bar: `2` (Label: `pick-up blue`)
* Yellow bar: `2` (Label: `pick-up yellow`)
* **Legend (Center):** Color-coded squares with action labels: Red=`unstack red`, Blue=`pick-up blue`, Yellow=`pick-up yellow`.
* **Center - CD Logits Box (S<sub>CD₁</sub>):**
* Title: `CD Logits (S<sub>CD₁</sub>):`
* Action List:
* `unstack red` (highlighted in yellow with a green checkmark ✅)
* `pick up blue`
* `pick up yellow`
* **Right - State Transition Diagram (a₀):**
* **Initial State Circle (Top):** Shows three blocks on a surface: a red block stacked on a green block, a blue block, and a yellow block.
* **Action Arrow:** Labeled `unstack the red`, pointing from the initial state to the next state.
* **Resulting State Circle (Middle):** Shows the red block being lifted off the green block (indicated by an upward arrow). The green, blue, and yellow blocks remain on the surface.
* **Alternative Action Ghost Circles (Dashed):** Two faint circles to the right show alternative outcomes: picking up the blue block or picking up the yellow block.
**3. State S₂ Section:**
* **Left - Bar Charts:**
* **Expert Logits (S<sub>E₂</sub>):**
* Yellow bar: `7` (Label: `stack on yellow` from legend)
* Blue bar: `1` (Label: `stack on blue`)
* Green bar: `1` (Label: `stack on green`)
* Red bar: `1` (Label: `put-down red`)
* **Amateur Logits (S<sub>A₂</sub>):**
* Yellow bar: `3` (Label: `stack on yellow`)
* Blue bar: `2` (Label: `stack on blue`)
* Green bar: `2` (Label: `stack on green`)
* Red bar: `3` (Label: `put-down red`)
* **Legend (Center):** Color-coded squares: Yellow=`stack on yellow`, Blue=`stack on blue`, Green=`stack on green`, Red=`put-down red`.
* **Center - CD Logits Box (S<sub>CD₂</sub>):**
* Title: `CD Logits (S<sub>CD₂</sub>):`
* Action List:
* `stack on yellow` (highlighted in yellow with a green checkmark ✅)
* `stack on blue`
* `stack on green`
* `put-down red`
* **Right - State Transition Diagram (a₁):**
* **Initial State Circle (Left):** Shows the state after S₁'s action: red block held above the surface, green, blue, and yellow blocks on the surface.
* **Action Arrow:** Labeled `stack on The yellow`, pointing from this state to the goal state.
* **Goal State Circle (Right):** Shows the red block placed on top of the yellow block. The green and blue blocks are separate on the surface.
* **Alternative Action Ghost Circles (Dashed):** Three faint circles show alternatives: stacking on blue, stacking on green, or putting the red block down on the surface.
### Detailed Analysis
**State S₁ Analysis:**
* **Trend Verification:** The Expert Logits show a very strong, singular preference for `unstack red` (value 8), with minimal weight on other actions (1 each). The Amateur Logits also favor `unstack red` (value 6) but with more distributed confidence (2 each on alternatives).
* **Action Selection:** The CD Logits box (`S<sub>CD₁</sub>`) selects `unstack red`, which aligns with the highest expert logit and is marked as correct (✅). This action is visually depicted in the state transition diagram `a₀`.
* **Spatial Grounding:** The legend for S₁ is positioned between the bar charts and the CD Logits box. The red color in the bar charts corresponds exactly to the `unstack red` label in the legend.
**State S₂ Analysis:**
* **Trend Verification:** Following the `unstack red` action, the Expert Logits now show a strong preference for `stack on yellow` (value 7). The Amateur Logits are highly uncertain, with nearly equal weight on `stack on yellow` (3) and `put-down red` (3), and moderate weight on other stacking options (2 each).
* **Action Selection:** The CD Logits box (`S<sub>CD₂</sub>`) selects `stack on yellow`, again matching the highest expert logit and marked correct (✅). This action completes the goal, as shown in the final state of diagram `a₁`.
* **Spatial Grounding:** The legend for S₂ is positioned similarly to S₁. The yellow color in the bar charts corresponds to the `stack on yellow` label.
### Key Observations
1. **Expert vs. Amateur Confidence:** The Expert model demonstrates high confidence (peaked distributions) in the correct action at each step. The Amateur model shows lower confidence and more uncertainty (flatter distributions), considering incorrect or suboptimal actions more seriously.
2. **Sequential Decision-Making:** The diagram clearly breaks down a long-horizon goal ("red on yellow") into a sequence of two discrete, correct sub-goals: first `unstack red`, then `stack on yellow`.
3. **Visual Confirmation:** Each selected action in the CD Logits boxes is visually validated by the corresponding state transition diagram, showing the physical change in the block world.
4. **Alternative Paths:** The dashed "ghost" circles explicitly show the alternative actions that were considered (especially by the Amateur model) but not taken, highlighting the planning choices.
### Interpretation
This diagram serves as an explanatory model for how a hierarchical or critic-guided planning system (represented by "CD Logits") might operate. It suggests that:
* **The "Expert" model (`S_E`) provides a strong, correct policy signal.** Its logits are sharply peaked on the action that makes progress toward the goal.
* **The "Amateur" model (`S_A`) represents a noisier, less reliable policy.** Its broader distributions indicate it is less certain about the optimal action, potentially exploring more of the action space.
* **The "CD Logits" (`S_CD`) mechanism acts as a decision-making layer.** It appears to successfully select the correct action, likely by leveraging the expert signal or some form of consensus/critique, as indicated by the green checkmarks. The process demonstrates effective **sub-goal decomposition**—breaking a complex goal into a tractable sequence of primitive actions.
* The overall narrative is one of **guided planning**: using a stronger signal (expert) to steer a weaker one (amateur) or to verify a plan, ensuring efficient and correct task completion in a symbolic domain. The contrast in logit distributions visually argues for the value of having a reliable expert model or a robust decision-fusion mechanism in AI planning systems.
DECODING INTELLIGENCE...