\n
## Line Chart: Accuracy vs. Reasoning Depth
### Overview
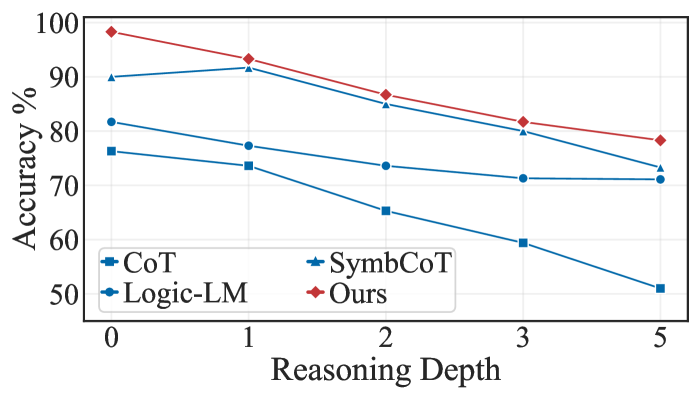
The image displays a line chart comparing the performance of four different methods or models on a task requiring varying depths of reasoning. The chart plots "Accuracy %" against "Reasoning Depth," showing a general downward trend for all methods as reasoning complexity increases.
### Components/Axes
* **Chart Type:** Multi-series line chart with markers.
* **Y-Axis:** Labeled "Accuracy %". The scale runs from 50 to 100, with major gridlines at intervals of 10 (50, 60, 70, 80, 90, 100).
* **X-Axis:** Labeled "Reasoning Depth". The marked data points are at depths 0, 1, 2, 3, and 5. The value 4 is not plotted.
* **Legend:** Positioned in the bottom-left corner of the chart area. It contains four entries:
* `CoT`: Blue line with square markers (■).
* `SymbCoT`: Blue line with upward-pointing triangle markers (▲).
* `Logic-LM`: Blue line with circle markers (●).
* `Ours`: Red line with diamond markers (◆).
### Detailed Analysis
The chart tracks the accuracy of four methods across five reasoning depth levels. Below is an analysis of each series, including its visual trend and approximate data points.
**1. CoT (Blue line, square markers ■)**
* **Trend:** Shows the steepest and most consistent decline in accuracy as reasoning depth increases.
* **Data Points (Approximate):**
* Depth 0: ~76%
* Depth 1: ~74%
* Depth 2: ~66%
* Depth 3: ~60%
* Depth 5: ~51%
**2. SymbCoT (Blue line, triangle markers ▲)**
* **Trend:** Starts with high accuracy, peaks slightly at depth 1, then declines steadily. It maintains the second-highest performance throughout.
* **Data Points (Approximate):**
* Depth 0: ~90%
* Depth 1: ~92%
* Depth 2: ~85%
* Depth 3: ~80%
* Depth 5: ~74%
**3. Logic-LM (Blue line, circle markers ●)**
* **Trend:** Shows a moderate, relatively steady decline. Its performance is consistently between CoT and SymbCoT.
* **Data Points (Approximate):**
* Depth 0: ~82%
* Depth 1: ~78%
* Depth 2: ~74%
* Depth 3: ~72%
* Depth 5: ~71%
**4. Ours (Red line, diamond markers ◆)**
* **Trend:** Demonstrates the highest accuracy at every reasoning depth. It declines gradually but remains significantly above the other methods.
* **Data Points (Approximate):**
* Depth 0: ~98%
* Depth 1: ~94%
* Depth 2: ~87%
* Depth 3: ~82%
* Depth 5: ~78%
### Key Observations
1. **Universal Performance Degradation:** All four methods experience a decrease in accuracy as the reasoning depth increases from 0 to 5.
2. **Consistent Hierarchy:** The performance ranking (`Ours` > `SymbCoT` > `Logic-LM` > `CoT`) is maintained at every measured reasoning depth.
3. **Differential Resilience:** The method labeled "Ours" and "SymbCoT" show greater resilience to increased reasoning depth compared to "CoT" and "Logic-LM". The gap between the best (`Ours`) and worst (`CoT`) performer widens significantly at greater depths (from a ~22% gap at depth 0 to a ~27% gap at depth 5).
4. **Missing Data Point:** There is no data plotted for Reasoning Depth = 4.
### Interpretation
This chart presents a comparative evaluation of reasoning capabilities. The "Reasoning Depth" likely corresponds to the number of logical or computational steps required to solve a problem.
* **What the data suggests:** The proposed method ("Ours") demonstrates superior and more robust performance, maintaining high accuracy even as problems become more complex. This implies it has a more effective architecture or training for multi-step reasoning tasks compared to the baseline methods (CoT, SymbCoT, Logic-LM).
* **Relationship between elements:** The downward slope for all lines is the central relationship, quantifying the "cost" of complexity. The vertical separation between the lines at any given x-value represents the performance advantage of one method over another for a fixed problem difficulty.
* **Notable trends/anomalies:** The most notable trend is the diverging performance. While all methods degrade, the rate of degradation varies. "CoT" degrades rapidly, suggesting it struggles significantly with deeper reasoning chains. "Ours" degrades the slowest, indicating better generalization to complex problems. The absence of data at depth 4 is an anomaly in the experimental reporting but does not obscure the clear overall trend.