## Chart: Paper Folding Accuracy vs. Number of Training Samples
### Overview
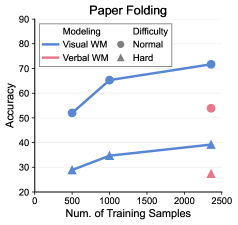
The image is a scatter plot showing the accuracy of two modeling types (Visual WM and Verbal WM) on a paper folding task, plotted against the number of training samples. The difficulty of the task (Normal and Hard) is also indicated.
### Components/Axes
* **Title:** Paper Folding
* **X-axis:** Num. of Training Samples, ranging from 0 to 2500. Axis markers are present at 0, 500, 1000, 1500, 2000, and 2500.
* **Y-axis:** Accuracy, ranging from 20 to 90. Axis markers are present at 20, 30, 40, 50, 60, 70, 80, and 90.
* **Legend (top-left):**
* **Modeling:**
* Visual WM (blue line)
* Verbal WM (pink line)
* **Difficulty (top-right):**
* Normal (gray circle)
* Hard (gray triangle)
### Detailed Analysis
* **Visual WM (Normal Difficulty):** The blue line with circle markers represents the accuracy of the Visual WM model on the normal difficulty task. The line slopes upward.
* At 500 training samples, the accuracy is approximately 52%.
* At 1000 training samples, the accuracy is approximately 65%.
* At 2300 training samples, the accuracy is approximately 72%.
* **Visual WM (Hard Difficulty):** The blue line with triangle markers represents the accuracy of the Visual WM model on the hard difficulty task. The line slopes upward.
* At 500 training samples, the accuracy is approximately 28%.
* At 1000 training samples, the accuracy is approximately 35%.
* At 2300 training samples, the accuracy is approximately 39%.
* **Verbal WM (Normal Difficulty):** The pink circle represents the accuracy of the Verbal WM model on the normal difficulty task.
* At 2300 training samples, the accuracy is approximately 54%.
* **Verbal WM (Hard Difficulty):** The pink triangle represents the accuracy of the Verbal WM model on the hard difficulty task.
* At 2300 training samples, the accuracy is approximately 27%.
### Key Observations
* The accuracy of the Visual WM model increases with the number of training samples for both normal and hard difficulty tasks.
* The Visual WM model performs better on the normal difficulty task compared to the hard difficulty task.
* The Verbal WM model has a single data point at 2300 training samples for both normal and hard difficulty tasks.
* The Visual WM model generally outperforms the Verbal WM model, especially at lower training sample sizes.
### Interpretation
The data suggests that the Visual WM model is more effective than the Verbal WM model for the paper folding task, particularly when the number of training samples is limited. Increasing the number of training samples improves the accuracy of the Visual WM model. The difficulty of the task significantly impacts the accuracy of both models, with the normal difficulty task resulting in higher accuracy. The single data point for the Verbal WM model limits the ability to analyze its performance trend with varying training samples. The Visual WM model's performance increase with more training data indicates that it benefits from increased exposure to the task.