## Line Chart with Scatter Points: Paper Folding
### Overview
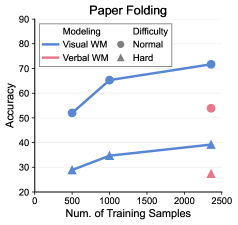
The image displays a line chart titled "Paper Folding," plotting model accuracy against the number of training samples. It compares two modeling approaches ("Visual WM" and "Verbal WM") across two difficulty levels ("Normal" and "Hard"). The "Normal" difficulty is represented by lines connecting data points, while the "Hard" difficulty is represented by isolated scatter points at the highest training sample count.
### Components/Axes
* **Title:** "Paper Folding" (centered at the top).
* **X-Axis:** Labeled "Num. of Training Samples." The scale runs from 0 to 2500, with major tick marks at 0, 500, 1000, 1500, 2000, and 2500.
* **Y-Axis:** Labeled "Accuracy." The scale runs from 20 to 90, with major tick marks at 20, 30, 40, 50, 60, 70, 80, and 90.
* **Legend (Top-Left Corner):**
* **Modeling:**
* Blue line with circle markers: "Visual WM"
* Red line with triangle markers: "Verbal WM"
* **Difficulty:**
* Circle marker: "Normal"
* Triangle marker: "Hard"
### Detailed Analysis
**Data Series & Trends:**
1. **Visual WM - Normal Difficulty (Blue Line with Circles):**
* **Trend:** Shows a strong, consistent upward trend. Accuracy increases significantly as the number of training samples grows.
* **Data Points (Approximate):**
* At 500 samples: ~52% accuracy
* At 1000 samples: ~65% accuracy
* At 2500 samples: ~72% accuracy
2. **Verbal WM - Normal Difficulty (Red Line with Triangles):**
* **Trend:** Shows a moderate, steady upward trend. Accuracy improves with more training samples, but at a slower rate and from a lower baseline than Visual WM.
* **Data Points (Approximate):**
* At 500 samples: ~29% accuracy
* At 1000 samples: ~34% accuracy
* At 2500 samples: ~39% accuracy
3. **Hard Difficulty Data Points (Scatter Points at 2500 Samples):**
* **Visual WM - Hard (Blue Circle):** Positioned at approximately 54% accuracy.
* **Verbal WM - Hard (Red Triangle):** Positioned at approximately 27% accuracy.
### Key Observations
1. **Performance Gap:** There is a substantial and consistent performance gap between the "Visual WM" and "Verbal WM" models across all training sample sizes for the "Normal" difficulty. Visual WM is significantly more accurate.
2. **Impact of Difficulty:** For both modeling approaches, performance on the "Hard" difficulty (at 2500 samples) is markedly lower than on the "Normal" difficulty at the same sample size.
* Visual WM drops from ~72% (Normal) to ~54% (Hard).
* Verbal WM drops from ~39% (Normal) to ~27% (Hard).
3. **Scaling Behavior:** Both models show improved accuracy with more training data, suggesting they benefit from increased sample size. The slope of improvement appears steeper for Visual WM.
4. **Relative Difficulty Impact:** The absolute drop in accuracy when moving from Normal to Hard difficulty is larger for the Visual WM model (~18 percentage points) than for the Verbal WM model (~12 percentage points), though Verbal WM starts from a much lower baseline.
### Interpretation
The data suggests that for the "Paper Folding" task, a modeling approach based on **Visual Working Memory (WM) is substantially more effective** than one based on Verbal Working Memory, achieving nearly double the accuracy with sufficient training data.
The consistent upward trends indicate that **both models are learning and generalizing** from the provided training samples, with no clear sign of performance plateauing within the tested range (up to 2500 samples). This implies that providing even more data could yield further improvements.
The significant performance degradation on the "Hard" difficulty level for both models demonstrates that the task's complexity scales with difficulty. The fact that the **Verbal WM model performs very poorly on the Hard task** (27% accuracy) suggests its representational strategy may be particularly ill-suited for handling the increased complexity, possibly involving spatial reasoning or mental manipulation that is more naturally encoded visually.
In summary, the chart provides strong evidence that **visual representations are superior to verbal ones for this specific paper folding task**, and that task difficulty critically modulates performance for both representational types. The results could inform the design of AI systems for spatial reasoning tasks, favoring visual encoding mechanisms.