\n
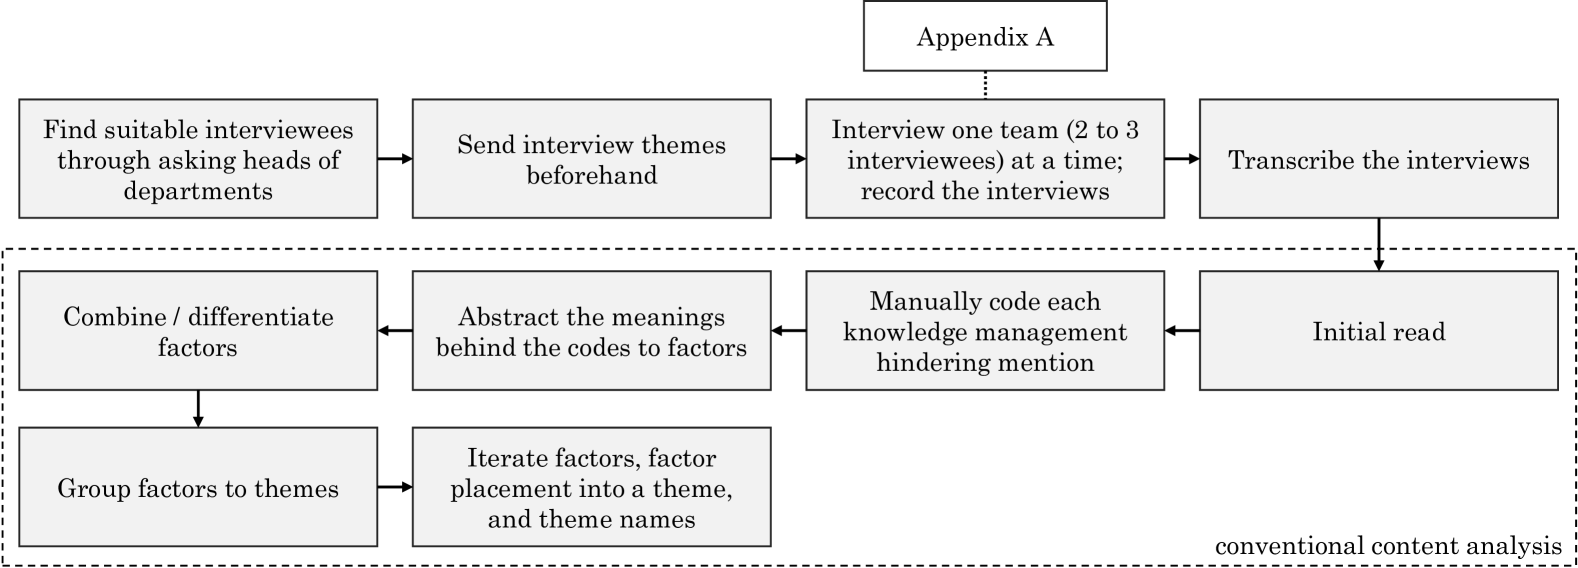
## Diagram: Qualitative Data Analysis Process - Appendix A
### Overview
The image depicts a flowchart outlining a process for qualitative data analysis, specifically related to knowledge management hindering mentions. The process begins with identifying interviewees and culminates in conventional content analysis. The diagram is structured in two main sections: an initial phase of data collection and preparation (top row), and a subsequent phase of data analysis and thematic development (bottom row). The entire diagram is labeled "Appendix A" at the top-center.
### Components/Axes
The diagram consists of rectangular boxes representing process steps, connected by arrows indicating the flow of the process. There are no axes in the traditional sense, but the diagram is organized horizontally, representing a sequential workflow. The bottom-right corner is labeled "conventional content analysis".
### Detailed Analysis or Content Details
The process steps, in order, are as follows:
1. **Find suitable interviewees through asking heads of departments.** (Top-left)
2. **Send interview themes beforehand.** (Top-center-left)
3. **Interview one team (2 to 3 interviewees) at a time; record the interviews.** (Top-center-right)
4. **Transcribe the interviews.** (Top-right)
5. **Combine / differentiate factors.** (Bottom-left)
6. **Abstract the meanings behind the codes to factors.** (Bottom-center-left)
7. **Manually code each knowledge management hindering mention.** (Bottom-center-right)
8. **Initial read.** (Bottom-right)
9. **Group factors to themes.** (Bottom-left, below "Combine / differentiate factors")
10. **Iterate factors, factor placement into a theme, and theme names.** (Bottom-center, below "Abstract the meanings behind the codes to factors")
The entire bottom row of steps is enclosed within a dashed-line rectangle. The arrows indicate a flow from left to right, with feedback loops implied by the connections between the bottom-row steps.
### Key Observations
The diagram highlights a systematic approach to qualitative data analysis. The process emphasizes both the collection of rich data (interviews) and a rigorous analytical process (coding, abstraction, thematic development). The inclusion of "conventional content analysis" suggests a grounded theory approach, where themes emerge from the data itself rather than being pre-defined.
### Interpretation
This diagram illustrates a methodology for understanding the factors that hinder knowledge management, as revealed through interviews. The process is iterative, with steps like "Iterate factors..." suggesting a refinement of themes based on ongoing analysis. The emphasis on manual coding indicates a detailed and nuanced approach to data interpretation. The diagram suggests a research design aimed at identifying and categorizing the specific challenges to knowledge sharing within an organization. The use of interviews with multiple team members (2-3 at a time) suggests a desire to capture diverse perspectives. The overall process is designed to move from raw interview data to a set of well-defined themes that represent the key obstacles to effective knowledge management.