## Line Chart: Accuracy vs. Epochs for Different Methods
### Overview
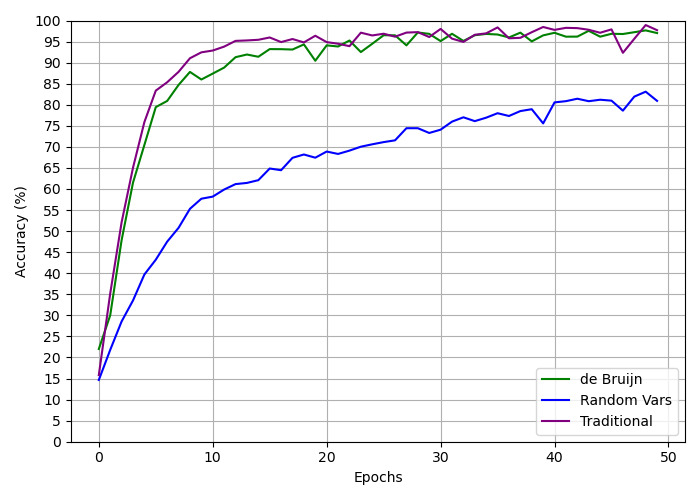
The image is a line chart comparing the accuracy of three different methods ("de Bruijn", "Random Vars", and "Traditional") over 50 epochs. The chart displays accuracy (in percentage) on the y-axis and the number of epochs on the x-axis.
### Components/Axes
* **X-axis:** Epochs, labeled from 0 to 50 in increments of 10.
* **Y-axis:** Accuracy (%), labeled from 0 to 100 in increments of 5.
* **Legend:** Located in the bottom-right corner, it identifies the three methods:
* "de Bruijn" (Green line)
* "Random Vars" (Dark Blue line)
* "Traditional" (Purple line)
* **Grid:** The chart has a grid for easier value reading.
### Detailed Analysis
* **de Bruijn (Green):**
* Trend: Rapid initial increase in accuracy, followed by stabilization around 90-95% after approximately 10 epochs.
* Data Points: Starts around 22% at epoch 0, reaches approximately 87% by epoch 8, and fluctuates between 90% and 98% from epoch 10 onwards.
* **Random Vars (Dark Blue):**
* Trend: Gradual increase in accuracy over the epochs, reaching a plateau around 75-80% after approximately 40 epochs.
* Data Points: Starts around 15% at epoch 0, reaches approximately 58% by epoch 8, 70% by epoch 20, and fluctuates between 75% and 82% from epoch 40 onwards.
* **Traditional (Purple):**
* Trend: Very rapid initial increase in accuracy, reaching a plateau around 95% after approximately 10 epochs.
* Data Points: Starts around 15% at epoch 0, reaches approximately 85% by epoch 6, and fluctuates between 92% and 98% from epoch 10 onwards.
### Key Observations
* The "Traditional" method and "de Bruijn" method achieve significantly higher accuracy compared to the "Random Vars" method.
* The "Traditional" method and "de Bruijn" method converge to high accuracy much faster than the "Random Vars" method.
* The "Traditional" method shows a slightly faster initial increase in accuracy compared to the "de Bruijn" method.
* All three methods show some fluctuations in accuracy after reaching their respective plateaus.
### Interpretation
The chart demonstrates the performance of three different methods in terms of accuracy over a series of epochs. The "Traditional" and "de Bruijn" methods are superior to the "Random Vars" method, achieving higher accuracy and faster convergence. The "Random Vars" method, while improving over time, plateaus at a significantly lower accuracy level. The fluctuations observed after the initial convergence suggest that further training may not significantly improve the accuracy of these methods. The data suggests that the "Traditional" and "de Bruijn" methods are more effective for the task being evaluated.