## Line Chart: Accuracy vs. Epochs for Different Methods
### Overview
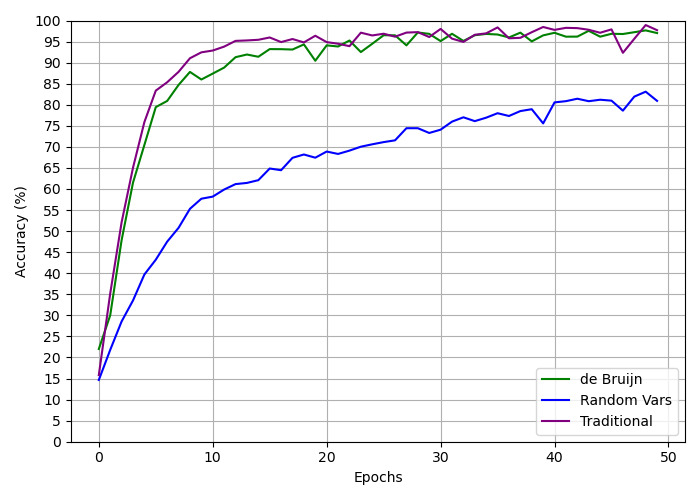
This image presents a line chart illustrating the accuracy of three different methods ("de Bruijn", "Random Vars", and "Traditional") over 50 epochs. The y-axis represents accuracy in percentage, while the x-axis represents the number of epochs. The chart visually compares the learning curves of these methods.
### Components/Axes
* **X-axis:** "Epochs" ranging from 0 to 50.
* **Y-axis:** "Accuracy (%)" ranging from 5 to 100.
* **Legend:** Located at the bottom-right corner, identifying the three data series:
* "de Bruijn" (Green line)
* "Random Vars" (Blue line)
* "Traditional" (Purple line)
* **Gridlines:** Horizontal and vertical gridlines are present to aid in reading values.
### Detailed Analysis
**de Bruijn (Green Line):**
The green line starts at approximately 15% accuracy at epoch 0. It exhibits a steep upward slope initially, reaching around 85% accuracy by epoch 5. The line then plateaus, fluctuating between approximately 93% and 97% accuracy for epochs 5 to 40. A slight dip occurs around epoch 45, dropping to approximately 90%, before recovering slightly to around 93% at epoch 50.
* Epoch 0: ~15%
* Epoch 5: ~85%
* Epoch 10: ~92%
* Epoch 20: ~95%
* Epoch 30: ~96%
* Epoch 40: ~96%
* Epoch 50: ~93%
**Random Vars (Blue Line):**
The blue line begins at approximately 10% accuracy at epoch 0. It shows a slower, more gradual increase compared to the "de Bruijn" method. It reaches around 65% accuracy by epoch 10, 75% by epoch 20, and plateaus around 78-82% accuracy from epoch 30 onwards, with some fluctuations.
* Epoch 0: ~10%
* Epoch 5: ~30%
* Epoch 10: ~65%
* Epoch 20: ~75%
* Epoch 30: ~79%
* Epoch 40: ~80%
* Epoch 50: ~81%
**Traditional (Purple Line):**
The purple line starts at approximately 10% accuracy at epoch 0. It rises rapidly, reaching around 90% accuracy by epoch 5. It then plateaus, maintaining a high accuracy level between approximately 95% and 99% for most of the epochs. There is a slight dip around epoch 45, similar to the "de Bruijn" method, dropping to around 94% before recovering to approximately 96% at epoch 50.
* Epoch 0: ~10%
* Epoch 5: ~90%
* Epoch 10: ~95%
* Epoch 20: ~97%
* Epoch 30: ~98%
* Epoch 40: ~98%
* Epoch 50: ~96%
### Key Observations
* The "Traditional" method consistently achieves the highest accuracy throughout the training process.
* The "de Bruijn" method demonstrates rapid initial learning but plateaus earlier than the "Traditional" method.
* The "Random Vars" method exhibits the slowest learning rate and reaches the lowest final accuracy.
* All three methods show a slight dip in accuracy around epoch 45, suggesting a potential overfitting or instability at that point.
### Interpretation
The chart demonstrates the performance of three different methods for a machine learning task, likely a classification or regression problem, as accuracy is the metric used. The "Traditional" method appears to be the most effective, achieving the highest accuracy and maintaining it throughout the training process. The "de Bruijn" method shows promise with its fast initial learning but may require further optimization to avoid plateauing. The "Random Vars" method is the least effective, indicating that the random variables used may not be sufficiently informative or that the method requires a different approach. The dip in accuracy around epoch 45 for all methods could indicate a need for regularization techniques or a different learning rate schedule to prevent overfitting. The data suggests that the choice of method significantly impacts the performance of the model, and the "Traditional" method is the preferred choice based on this data.