## Line Graph: Accuracy vs. Epochs for Different Methods
### Overview
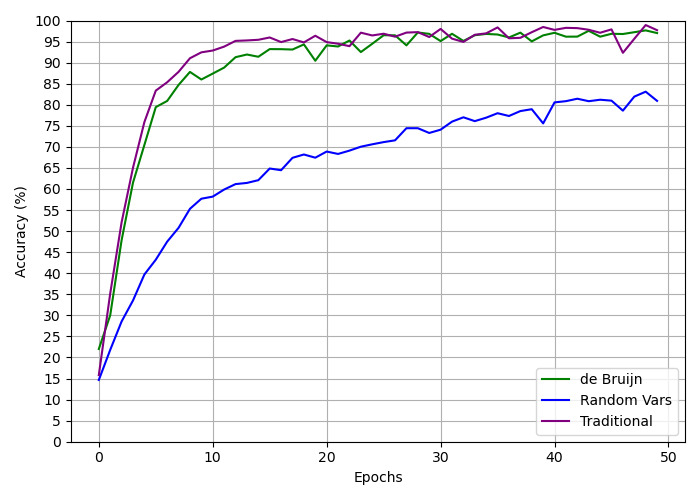
The image depicts a line graph comparing the accuracy (%) of three methods—**de Bruijn**, **Random Vars**, and **Traditional**—over 50 epochs. The y-axis represents accuracy (0–100%), and the x-axis represents epochs (0–50). All three lines show increasing trends, but with distinct patterns.
---
### Components/Axes
- **X-axis (Epochs)**: Labeled "Epochs," ranging from 0 to 50 in increments of 10.
- **Y-axis (Accuracy %)**: Labeled "Accuracy (%)", ranging from 0 to 100 in increments of 5.
- **Legend**: Located in the **bottom-right corner**, with three entries:
- **Green line**: "de Bruijn"
- **Blue line**: "Random Vars"
- **Purple line**: "Traditional"
---
### Detailed Analysis
#### de Bruijn (Green Line)
- **Initial Trend**: Starts at ~20% accuracy at epoch 0, rising sharply to ~95% by epoch 10.
- **Stabilization**: Fluctuates slightly between ~90% and 95% from epoch 10 to 50, with minor dips (e.g., ~92% at epoch 20).
- **Final Value**: ~97% at epoch 50.
#### Random Vars (Blue Line)
- **Initial Trend**: Starts at ~15% accuracy at epoch 0, rising gradually to ~65% by epoch 20.
- **Acceleration**: Increases more steeply after epoch 20, reaching ~80% by epoch 40.
- **Final Value**: ~82% at epoch 50.
#### Traditional (Purple Line)
- **Initial Trend**: Starts at ~15% accuracy at epoch 0, rising sharply to ~95% by epoch 10.
- **Stabilization**: Fluctuates between ~95% and 98% from epoch 10 to 50, with a minor dip to ~93% at epoch 35.
- **Final Value**: ~97% at epoch 50.
---
### Key Observations
1. **Rapid Initial Growth**: All three methods show steep accuracy gains in the first 10 epochs.
2. **Convergence**: By epoch 10, **de Bruijn** and **Traditional** plateau near 95%, while **Random Vars** lags at ~60%.
3. **Divergence**: **Random Vars** improves more slowly but steadily, closing the gap to ~80% by epoch 40.
4. **Anomaly**: The **Traditional** line dips slightly (~93%) at epoch 35 but recovers quickly.
---
### Interpretation
- **Efficiency**: **de Bruijn** and **Traditional** methods achieve high accuracy rapidly, suggesting superior optimization or data utilization. Their near-identical performance implies they may share similar underlying mechanisms.
- **Random Vars**: The slower, gradual improvement indicates a less efficient algorithm, possibly due to stochastic variability or suboptimal hyperparameters.
- **Practical Implications**: For applications requiring quick convergence, **de Bruijn** or **Traditional** methods are preferable. **Random Vars** might be suitable for scenarios where computational resources allow longer training epochs.
- **Uncertainty**: Minor fluctuations (e.g., Traditional’s dip at epoch 35) suggest sensitivity to initialization or noise, but overall trends remain robust.