# Technical Data Extraction: Precision vs. $\beta$ (%) Chart
## 1. Component Isolation
* **Header:** None present.
* **Main Chart Area:** A line graph plotted on a light gray background with a broken Y-axis.
* **Legend:** Located in the bottom-right quadrant of the plot area.
* **Axes:**
* **Y-axis (Vertical):** Labeled "Precision". Range from 0.00 to 1.00, with a scale break between 0.00 and 0.75.
* **X-axis (Horizontal):** Labeled "$\beta$ (%)". Range from 0 to 80.
---
## 2. Axis and Legend Extraction
### Axis Labels and Markers
* **Y-axis (Precision):**
* Major Ticks: 0.00, 0.75, 0.80, 0.85, 0.90, 0.95, 1.00.
* Note: There is a visual break in the axis between 0.00 and 0.75.
* **X-axis ($\beta$ (%)):**
* Major Ticks: 0, 10, 20, 30, 40, 50, 60, 70, 80.
### Legend Details
The legend is located at approximately $[x=0.75, y=0.25]$ relative to the chart area.
* **Black line with Square markers ($\square$):** HDFS
* **Blue line with Upward Triangle markers ($\triangle$):** Liberty
* **Red line with Circle markers ($\circ$):** BGL
* **Green line with Downward Triangle markers ($\nabla$):** Thunderbird
---
## 3. Trend Verification and Data Extraction
### Series 1: HDFS (Black, Square)
* **Trend:** Extremely stable and high. The line remains nearly horizontal at the top of the chart.
* **Data Points (Approximate):**
* $\beta=0$ to $80$: Consistently maintains a precision of $\approx 0.99$ to $1.00$.
### Series 2: Liberty (Blue, Upward Triangle)
* **Trend:** High and stable with a slight upward shift early on.
* **Data Points (Approximate):**
* $\beta=0$ to $10$: $\approx 0.98$
* $\beta=20$ to $80$: Increases slightly and plateaus at $\approx 0.99$.
### Series 3: Thunderbird (Green, Downward Triangle)
* **Trend:** Sharp initial increase, followed by a stable plateau, and a significant decline after $\beta=50$.
* **Data Points (Approximate):**
* $\beta=0$: $0.00$
* $\beta=10$ to $50$: Plateaus at $\approx 0.96$.
* $\beta=60$: Drops to $\approx 0.93$.
* $\beta=70$: Drops to $\approx 0.87$.
* $\beta=80$: Drops to $\approx 0.85$.
### Series 4: BGL (Red, Circle)
* **Trend:** Moderate precision with a "hump" shape; it peaks at $\beta=40$ before declining.
* **Data Points (Approximate):**
* $\beta=0$ to $20$: $\approx 0.84$
* $\beta=30$: $\approx 0.86$
* $\beta=40$: Peaks at $\approx 0.88$.
* $\beta=50$: $\approx 0.86$
* $\beta=60$: $\approx 0.85$
* $\beta=70$: $\approx 0.81$
* $\beta=80$: $\approx 0.79$
---
## 4. Data Table Reconstruction
| $\beta$ (%) | HDFS (Black $\square$) | Liberty (Blue $\triangle$) | Thunderbird (Green $\nabla$) | BGL (Red $\circ$) |
| :--- | :--- | :--- | :--- | :--- |
| **0** | ~0.99 | ~0.98 | 0.00 | ~0.84 |
| **10** | ~0.99 | ~0.98 | ~0.96 | ~0.84 |
| **20** | ~0.99 | ~0.99 | ~0.96 | ~0.84 |
| **30** | ~0.99 | ~0.99 | ~0.96 | ~0.86 |
| **40** | ~0.99 | ~0.99 | ~0.96 | ~0.88 |
| **50** | ~0.99 | ~0.99 | ~0.96 | ~0.86 |
| **60** | ~0.99 | ~0.99 | ~0.93 | ~0.85 |
| **70** | ~0.99 | ~0.99 | ~0.87 | ~0.81 |
| **80** | ~0.99 | ~0.99 | ~0.85 | ~0.79 |
---
## 5. Summary of Findings
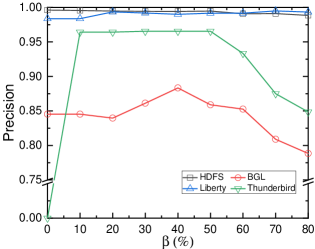
The chart evaluates the "Precision" of four different datasets (HDFS, Liberty, Thunderbird, and BGL) against a variable parameter $\beta$ expressed as a percentage.
* **HDFS and Liberty** are the most robust, maintaining near-perfect precision across the entire range of $\beta$.
* **Thunderbird** requires $\beta > 0$ to function (starting at 0 precision at $\beta=0$) but performs well until $\beta$ exceeds 50%, after which precision degrades.
* **BGL** shows the lowest overall precision of the group, peaking at $\beta=40\%$ and showing sensitivity to higher values of $\beta$.