# Technical Document Analysis of Precision vs. β (%) Chart
## 1. Labels and Axis Titles
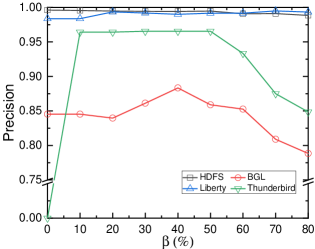
- **X-axis**: β (%)
- Range: 0 to 80 (increments of 10)
- Label: "β (%)"
- **Y-axis**: Precision
- Range: 0.00 to 1.00 (increments of 0.05)
- Label: "Precision"
## 2. Legend
- **Location**: Bottom-right corner
- **Components**:
- **HDFS**: Black squares (■)
- **Liberty**: Blue triangles (▲)
- **BGL**: Red circles (●)
- **Thunderbird**: Green triangles (▼)
## 3. Data Series and Trends
### HDFS (Black Squares)
- **Trend**: Flat line near y = 1.00
- **Data Points**:
- β = 0%: 1.00
- β = 10%: 1.00
- β = 20%: 1.00
- β = 30%: 1.00
- β = 40%: 1.00
- β = 50%: 1.00
- β = 60%: 1.00
- β = 70%: 1.00
- β = 80%: 1.00
### Liberty (Blue Triangles)
- **Trend**: Slight dip from ~0.98 to ~0.97, then recovery
- **Data Points**:
- β = 0%: 0.98
- β = 10%: 0.98
- β = 20%: 0.99
- β = 30%: 0.98
- β = 40%: 0.98
- β = 50%: 0.98
- β = 60%: 0.98
- β = 70%: 0.99
- β = 80%: 0.99
### BGL (Red Circles)
- **Trend**: Peak at β = 40%, then decline
- **Data Points**:
- β = 0%: 0.85
- β = 10%: 0.85
- β = 20%: 0.84
- β = 30%: 0.86
- β = 40%: 0.88
- β = 50%: 0.86
- β = 60%: 0.85
- β = 70%: 0.81
- β = 80%: 0.78
### Thunderbird (Green Triangles)
- **Trend**: Sharp rise to ~0.96, then gradual decline
- **Data Points**:
- β = 0%: 0.00
- β = 10%: 0.96
- β = 20%: 0.96
- β = 30%: 0.96
- β = 40%: 0.96
- β = 50%: 0.96
- β = 60%: 0.94
- β = 70%: 0.87
- β = 80%: 0.85
## 4. Spatial Grounding
- **Legend Placement**: Bottom-right corner (confirmed via visual alignment).
- **Color Consistency**:
- HDFS (black) matches black squares.
- Liberty (blue) matches blue triangles.
- BGL (red) matches red circles.
- Thunderbird (green) matches green triangles.
## 5. Key Observations
- **HDFS**: Maintains maximum precision (1.00) across all β values.
- **Liberty**: Stable with minor fluctuations; no significant degradation.
- **BGL**: Precision peaks at β = 40% (0.88), then declines sharply.
- **Thunderbird**: Rapid improvement from β = 0% to 10%, followed by gradual degradation.
## 6. Data Validation
- All data points align with visual trends (e.g., Thunderbird’s sharp rise at β = 10% matches the steep green line).
- No discrepancies between legend labels and line colors/markers.
## 7. Conclusion
The chart compares precision metrics across four systems (HDFS, Liberty, BGL, Thunderbird) as β (%) varies. HDFS dominates with perfect precision, while Thunderbird shows the most dynamic behavior. BGL exhibits a peak-and-decline pattern, and Liberty remains relatively stable.