## Diagram: Reward and Penalty System
### Overview
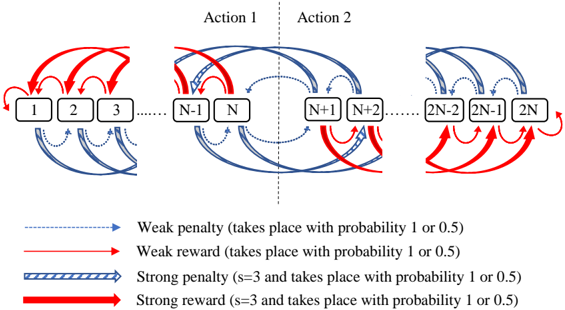
The image is a diagram illustrating a reward and penalty system across a series of states, labeled numerically from 1 to 2N. The system is divided into two actions, Action 1 and Action 2, separated by a vertical dashed line. The diagram shows transitions between states, with different types of arrows indicating weak and strong penalties/rewards. The probability of these events occurring is either 1 or 0.5.
### Components/Axes
* **States:** Represented by rectangular boxes labeled with numbers from 1 to 2N.
* **Actions:** The system is divided into two actions: Action 1 (states 1 to N) and Action 2 (states N+1 to 2N).
* **Arrows:** Represent transitions between states, with different styles indicating the type of reward or penalty.
* **Weak penalty:** Dashed blue arrow. Takes place with probability 1 or 0.5.
* **Weak reward:** Solid blue arrow. Takes place with probability 1 or 0.5.
* **Strong penalty:** Striped blue arrow. s=3 and takes place with probability 1 or 0.5.
* **Strong reward:** Solid red arrow. s=3 and takes place with probability 1 or 0.5.
### Detailed Analysis
**Action 1 (States 1 to N):**
* **States 1, 2, and 3:**
* Strong red arrows (strong reward) originate from states 1, 2, and 3, looping back to previous states. For example, from state 2, a strong reward arrow goes to state 1.
* Dashed blue arrows (weak penalty) originate from states 1, 2, and 3, looping forward to the next state. For example, from state 1, a weak penalty arrow goes to state 2.
* **States N-1 and N:**
* Solid blue arrows (weak reward) connect state N-1 to state N, and state N to state N-1, forming a loop.
* Dashed blue arrows (weak penalty) originate from states N-1 and N, looping forward to the next state (N and N+1 respectively).
* A strong red arrow (strong reward) originates from state N-1, looping back to state N-2 (not explicitly labeled, but implied).
**Action 2 (States N+1 to 2N):**
* **States N+1 and N+2:**
* Solid blue arrows (weak reward) connect state N+1 to state N+2, and state N+2 to state N+1, forming a loop.
* Dashed blue arrows (weak penalty) originate from states N+1 and N+2, looping forward to the next state (N+2 and N+3 respectively).
* A strong red arrow (strong reward) originates from state N+2, looping back to state N+1.
* **States 2N-2, 2N-1, and 2N:**
* Strong red arrows (strong reward) originate from states 2N-2, 2N-1, and 2N, looping back to previous states. For example, from state 2N, a strong reward arrow goes to state 2N-1.
* Dashed blue arrows (weak penalty) originate from states 2N-2, 2N-1, and 2N, looping forward to the next state. For example, from state 2N-2, a weak penalty arrow goes to state 2N-1.
### Key Observations
* The diagram illustrates a state-based system with transitions influenced by rewards and penalties.
* The system is divided into two distinct actions, with similar patterns of rewards and penalties within each action.
* Strong rewards tend to pull the system back to earlier states, while weak penalties tend to push the system forward.
* The probability of each event (reward or penalty) is either 1 or 0.5.
* The "strength" of the strong rewards and penalties is indicated by 's=3'.
### Interpretation
The diagram represents a Markov Decision Process (MDP) or a similar reinforcement learning environment. The states represent different conditions or configurations, and the actions (Action 1 and Action 2) represent different sets of possible choices. The rewards and penalties represent the consequences of transitioning between states. The diagram suggests a system where there is a balance between exploration (moving forward due to penalties) and exploitation (returning to previous states due to rewards). The probability values (1 or 0.5) indicate the certainty or uncertainty associated with each transition. The 's=3' likely indicates the magnitude of the reward or penalty when a strong event occurs. The system could be used to model various scenarios, such as resource allocation, game playing, or robot navigation, where agents need to learn optimal strategies to maximize rewards and minimize penalties.