## Diagram: Action-Based Reward/Penalty Flowchart
### Overview
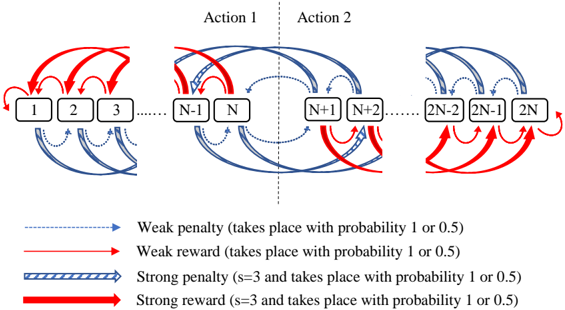
The diagram illustrates a two-phase process (Action 1 and Action 2) involving sequential node transitions with probabilistic rewards and penalties. Nodes are labeled numerically (1 to 2N), split into two groups: 1–N (left) and N+1–2N (right). Arrows represent transitions between nodes, differentiated by color/style to denote reward/penalty strength and probability.
### Components/Axes
- **Nodes**:
- Left group: 1, 2, 3, ..., N-1, N
- Right group: N+1, N+2, ..., 2N-2, 2N-1, 2N
- **Arrows**:
- **Red solid**: Strong reward (s=3, probability 1 or 0.5)
- **Blue dashed**: Weak penalty (probability 1 or 0.5)
- **Blue striped**: Strong penalty (s=3, probability 1 or 0.5)
- **Red dashed**: Weak reward (probability 1 or 0.5)
- **Legend**: Located at the bottom, centered. Colors/styles map to reward/penalty types.
- **Actions**:
- **Action 1**: Left-to-right flow (nodes 1–N).
- **Action 2**: Right-to-left flow (nodes N+1–2N).
### Detailed Analysis
1. **Action 1 (Left Group)**:
- Nodes 1–3: Red solid arrows (strong reward) point to N-1 and N.
- Nodes N-1 and N: Blue dashed arrows (weak penalty) loop back to earlier nodes (1–3).
- Nodes 4–N: Mixed red dashed (weak reward) and blue dashed (weak penalty) arrows.
2. **Action 2 (Right Group)**:
- Nodes N+1 and N+2: Blue dashed arrows (weak penalty) point to 2N-2 and 2N-1.
- Nodes 2N-2 and 2N-1: Red solid arrows (strong reward) point to 2N.
- Node 2N: Red dashed arrows (weak reward) loop back to N+1 and N+2.
3. **Probabilities**:
- Weak penalties/rewards: 50% chance (probability 0.5) or certainty (1).
- Strong penalties/rewards: s=3 (magnitude) with same probabilities.
### Key Observations
- **Feedback Loops**: Arrows from N-1/N and 2N-2/2N-1 loop back to earlier nodes, suggesting cyclical processes.
- **Asymmetry**: Action 1 emphasizes rewards (red arrows dominate), while Action 2 focuses on penalties (blue arrows dominate).
- **Node 2N**: Acts as a terminal node with weak reward feedback to Action 2’s start.
### Interpretation
The diagram models a decision-making system where actions trigger state transitions with probabilistic outcomes. Action 1 prioritizes high-reward paths (strong rewards to N-1/N), while Action 2 introduces risk via penalties (weak penalties to 2N-2/2N-1). Feedback loops imply iterative refinement or failure recovery. The use of "s=3" for strong penalties/rewards suggests a scaling factor for impact magnitude.
**Notable Anomalies**:
- Node 2N’s weak reward feedback to Action 2’s start creates a closed loop, potentially indicating a reset mechanism.
- Mixed arrow types within nodes 4–N (Action 1) suggest variable outcomes for intermediate states.
This structure could represent a reinforcement learning environment, workflow optimization, or risk-reward analysis framework. The probabilistic nature of transitions highlights uncertainty in outcomes, critical for modeling real-world systems.