## Flowchart: Wind Data Processing and Validation Workflow
### Overview
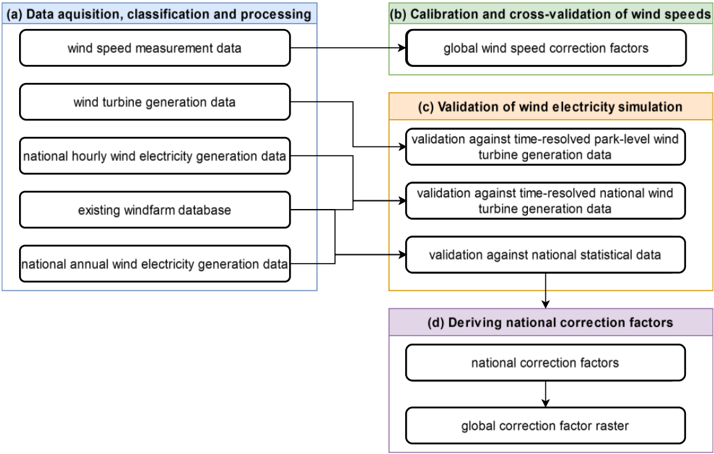
This flowchart illustrates a multi-stage process for acquiring, calibrating, validating, and deriving correction factors for wind data used in electricity generation simulations. It emphasizes data sources, validation methods, and the derivation of national/global correction factors.
### Components/Axes
- **Sections**:
- **(a) Data Acquisition, Classification, and Processing**:
- Wind speed measurement data
- Wind turbine generation data
- National hourly wind electricity generation data
- Existing windfarm database
- National annual wind electricity generation data
- **(b) Calibration and Cross-Validation of Wind Speeds**:
- Global wind speed correction factors
- **(c) Validation of Wind Electricity Simulation**:
- Validation against time-resolved park-level wind turbine generation data
- Validation against time-resolved national wind turbine generation data
- Validation against national statistical data
- **(d) Deriving National Correction Factors**:
- National correction factors
- Global correction factor raster
- **Flow Arrows**:
- Data from **(a)** feeds into **(b)**.
- **(b)** outputs to **(c)**.
- **(c)** outputs to **(d)**.
- **(d)** produces a "global correction factor raster" as the final output.
### Detailed Analysis
- **Section (a)**: Focuses on raw data inputs, including direct measurements (wind speed), turbine output, and aggregated national data (hourly/annual). The "existing windfarm database" suggests integration of historical operational data.
- **Section (b)**: Highlights calibration using "global wind speed correction factors," implying adjustments to raw wind speed data for consistency or accuracy.
- **Section (c)**: Validates simulations against three benchmarks:
1. Park-level turbine data (high-resolution, localized).
2. National turbine data (broader spatial coverage).
3. National statistical data (macro-level trends).
- **Section (d)**: Derives **national correction factors** from validation results, which are then aggregated into a **global correction factor raster** (spatial representation of corrections).
### Key Observations
1. **Hierarchical Validation**: Validation progresses from localized (park-level) to national scales, ensuring robustness.
2. **Data Integration**: Combines direct measurements (wind speed), operational data (turbine generation), and existing databases for comprehensive analysis.
3. **Output Structure**: The final "global correction factor raster" suggests a spatially explicit model for applying corrections across regions.
### Interpretation
This workflow underscores a systematic approach to improving wind energy simulations by:
- **Calibrating raw data** (Section b) to address measurement biases or inconsistencies.
- **Validating simulations** against multiple data sources (Section c) to ensure reliability at different scales.
- **Deriving correction factors** (Section d) to refine models for national and global applications.
The flowchart implies that corrections are data-driven and iterative, with validation at multiple scales reducing uncertainty. The "global correction factor raster" likely serves as a tool for spatial analysis, enabling region-specific adjustments in wind energy forecasting or resource assessment.
No numerical values or trends are explicitly provided in the diagram, but the structure emphasizes methodological rigor and scalability.