## Flow Diagram: Wind Electricity Simulation and Correction Factors
### Overview
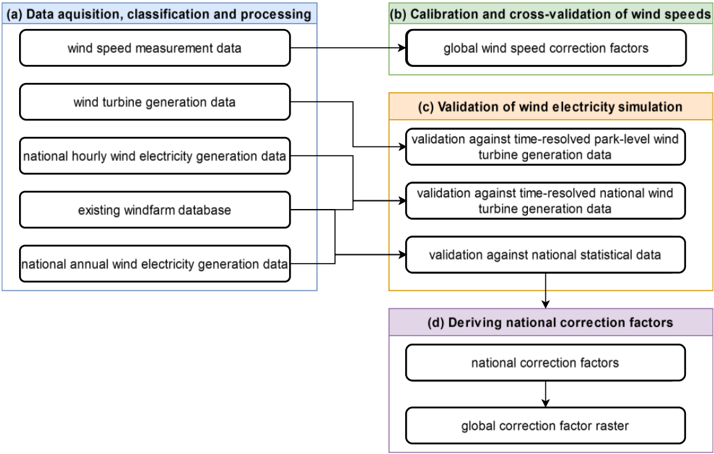
The image is a flow diagram illustrating the process of data acquisition, calibration, validation, and derivation of correction factors for wind electricity simulation. The diagram is divided into four main stages, each represented by a colored box: data acquisition, calibration, validation, and derivation. Arrows indicate the flow of data between these stages.
### Components/Axes
The diagram consists of four main sections, labeled (a) through (d):
* **(a) Data acquisition, classification and processing (Blue box):** This section outlines the initial data sources.
* **(b) Calibration and cross-validation of wind speeds (Green box):** This section describes the calibration process.
* **(c) Validation of wind electricity simulation (Orange box):** This section details the validation process.
* **(d) Deriving national correction factors (Purple box):** This section describes the derivation of correction factors.
Each section contains rounded rectangles representing specific data or processes. Arrows connect these rectangles to show the flow of information.
### Detailed Analysis or ### Content Details
**Section (a): Data acquisition, classification and processing (Blue box)**
* **Input Data:**
* wind speed measurement data
* wind turbine generation data
* national hourly wind electricity generation data
* existing windfarm database
* national annual wind electricity generation data
**Section (b): Calibration and cross-validation of wind speeds (Green box)**
* **Output Data:**
* global wind speed correction factors
**Section (c): Validation of wind electricity simulation (Orange box)**
* **Validation Processes:**
* validation against time-resolved park-level wind turbine generation data
* validation against time-resolved national wind turbine generation data
* validation against national statistical data
**Section (d): Deriving national correction factors (Purple box)**
* **Output Data:**
* national correction factors
* global correction factor raster
**Flow of Information:**
1. Data from section (a) flows into sections (b) and (c).
2. Data from section (c) flows into section (d).
3. Data from section (d) flows into the final output.
### Key Observations
* The diagram illustrates a sequential process, starting with data acquisition and ending with the derivation of correction factors.
* Multiple data sources are used in the initial stage.
* The validation stage involves comparisons with different types of data.
* The final output includes both national and global correction factors.
### Interpretation
The diagram provides a high-level overview of the process used to simulate wind electricity and derive correction factors. It highlights the importance of data acquisition, calibration, and validation in ensuring the accuracy of the simulation. The flow of information between the different stages is clearly illustrated, providing a clear understanding of the overall process. The diagram suggests a systematic approach to wind electricity simulation, emphasizing the need for reliable data and rigorous validation.