\n
## Diagram: Wind Energy Data Processing Workflow
### Overview
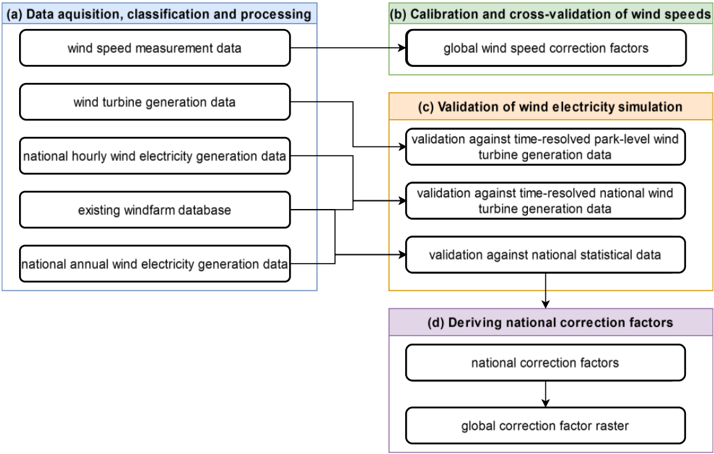
This diagram illustrates a workflow for processing wind energy data, encompassing data acquisition, calibration, validation, and the derivation of correction factors. The process flows from left to right, with data sources feeding into various stages of analysis and refinement. The diagram is segmented into four main phases, labeled (a) through (d), each with a distinct background color.
### Components/Axes
The diagram consists of rectangular boxes representing data sources or processing steps, connected by arrows indicating the flow of information. The phases are:
* **(a) Data acquisition, classification and processing** (Light Blue Background)
* **(b) Calibration and cross-validation of wind speeds** (Green Background)
* **(c) Validation of wind electricity simulation** (Yellow Background)
* **(d) Deriving national correction factors** (Purple Background)
The data sources/steps are:
* wind speed measurement data
* wind turbine generation data
* national hourly wind electricity generation data
* existing windfarm database
* national annual wind electricity generation data
* global wind speed correction factors
* validation against time-resolved park-level wind turbine generation data
* validation against time-resolved national wind turbine generation data
* validation against national statistical data
* national correction factors
* global correction factor raster
### Detailed Analysis or Content Details
The workflow proceeds as follows:
1. **Phase (a): Data acquisition, classification and processing:** Five data sources are listed vertically.
* "wind speed measurement data"
* "wind turbine generation data"
* "national hourly wind electricity generation data"
* "existing windfarm database"
* "national annual wind electricity generation data"
These sources all feed into Phase (c) with arrows.
2. **Phase (b): Calibration and cross-validation of wind speeds:** A single step is listed.
* "global wind speed correction factors"
This step feeds into Phase (c) with an arrow.
3. **Phase (c): Validation of wind electricity simulation:** Three validation steps are listed vertically.
* "validation against time-resolved park-level wind turbine generation data"
* "validation against time-resolved national wind turbine generation data"
* "validation against national statistical data"
All three validation steps receive input from Phase (a) and Phase (b). Phase (c) feeds into Phase (d) with an arrow.
4. **Phase (d): Deriving national correction factors:** Two steps are listed vertically.
* "national correction factors"
* "global correction factor raster"
The first step receives input from Phase (c), and the second step receives input from the first step.
### Key Observations
The diagram highlights a multi-stage process for refining wind energy data. The convergence of multiple data sources in the validation phase (c) suggests a robust approach to ensuring data accuracy. The final output, a "global correction factor raster," indicates the goal is to create a geographically-informed correction model. The diagram does not contain any numerical data.
### Interpretation
The diagram represents a data pipeline designed to improve the accuracy of wind energy data and modeling. The process begins with raw data acquisition and culminates in the creation of correction factors that can be applied to future data. The validation steps are crucial, as they compare simulation results against real-world observations at different scales (park-level, national, statistical). The workflow emphasizes a comprehensive approach, integrating various data sources and validation techniques to produce reliable correction factors. The final product, a "global correction factor raster," suggests the intention to create a spatially-explicit model for correcting wind speed or power generation estimates. The diagram is a high-level overview and does not detail the specific algorithms or methods used in each step.