## Scatter Plot: world_religions
### Overview
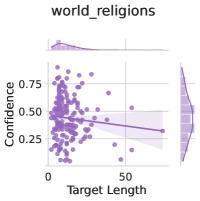
The image is a scatter plot titled "world_religions". It displays the relationship between "Target Length" on the x-axis and "Confidence" on the y-axis. The plot includes a regression line with a confidence interval shaded around it. Density plots are shown along both axes, indicating the distribution of the data.
### Components/Axes
* **Title:** world\_religions
* **X-axis:** Target Length
* Scale: 0 to 50
* **Y-axis:** Confidence
* Scale: 0.25 to 0.75
* **Data Points:** Purple dots scattered across the plot.
* **Regression Line:** A purple line showing the linear relationship between Target Length and Confidence, with a shaded confidence interval.
* **Marginal Density Plots:** Density plots along the x and y axes showing the distribution of Target Length and Confidence, respectively.
### Detailed Analysis
* **X-Axis (Target Length):** The data points are concentrated between 0 and 20, with fewer points beyond 20.
* **Y-Axis (Confidence):** The data points are mostly distributed between 0.25 and 0.75.
* **Regression Line:** The regression line has a slight negative slope, suggesting a weak negative correlation between Target Length and Confidence.
* **Data Points:**
* At Target Length = 0, Confidence ranges from approximately 0.3 to 0.75.
* At Target Length = 20, Confidence ranges from approximately 0.25 to 0.6.
* At Target Length = 50, Confidence is approximately 0.3.
### Key Observations
* There is a higher density of data points at lower Target Length values.
* The confidence values are relatively spread out, with a slight concentration around 0.5.
* The negative slope of the regression line suggests that as Target Length increases, Confidence tends to decrease slightly.
### Interpretation
The scatter plot suggests a weak negative correlation between Target Length and Confidence for the "world_religions" dataset. The concentration of data points at lower Target Length values indicates that shorter target lengths are more common in the dataset. The spread of confidence values suggests variability in the confidence levels associated with different target lengths. The regression line indicates a slight tendency for confidence to decrease as target length increases, but the relationship is not strong.