## Scatter Plot with Marginal Distributions: World Religions Confidence vs. Target Length
### Overview
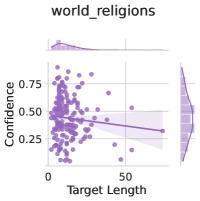
The image is a statistical visualization, specifically a scatter plot with marginal histograms and density plots. It displays the relationship between "Target Length" and "Confidence" for a dataset or model output labeled "world_religions". The plot includes a fitted regression line with a confidence interval.
### Components/Axes
* **Title:** `world_religions` (located at the top center).
* **Main Chart Area:**
* **X-Axis:** Labeled `Target Length`. The scale runs from 0 to approximately 70, with major tick marks visible at 0 and 50.
* **Y-Axis:** Labeled `Confidence`. The scale runs from 0.00 to 1.00, with major tick marks at 0.00, 0.25, 0.50, 0.75, and 1.00.
* **Data Series:** A single series represented by purple circular points. A legend in the top-left corner confirms this series is `world_religions`.
* **Trend Line:** A solid purple line representing a linear regression fit, surrounded by a semi-transparent purple shaded area representing the confidence interval for the fit.
* **Marginal Plots:**
* **Top (above X-axis):** A histogram and density plot for the `Target Length` variable. It shows a right-skewed distribution, with most data points clustered at lower target lengths (0-30).
* **Right (beside Y-axis):** A histogram and density plot for the `Confidence` variable. It shows a left-skewed distribution, with most data points clustered at higher confidence values (0.4-0.8).
### Detailed Analysis
* **Data Distribution & Trend:**
* **Trend Verification:** The purple regression line has a clear **downward slope** from left to right, indicating a negative correlation between Target Length and Confidence.
* **Data Point Cluster:** The highest density of purple data points is concentrated in the region where `Target Length` is between 0 and 30 and `Confidence` is between 0.25 and 0.75.
* **Estimated Trend Line Values:** The line appears to start at a Confidence of approximately 0.50 when Target Length is 0, and declines to a Confidence of approximately 0.25 when Target Length is 50.
* **Confidence Interval:** The shaded confidence interval around the trend line is relatively narrow at low Target Lengths but widens significantly as Target Length increases beyond 40, indicating greater uncertainty in the trend for longer targets.
* **Marginal Distributions:**
* **Target Length (Top):** The histogram bars are tallest on the left (0-10 range) and decrease in height to the right. The overlaid density curve confirms a strong positive (right) skew.
* **Confidence (Right):** The histogram bars are tallest in the 0.5-0.75 range and decrease towards both 0.0 and 1.0. The overlaid density curve confirms a negative (left) skew.
### Key Observations
1. **Negative Correlation:** There is a clear inverse relationship: as the `Target Length` increases, the model's `Confidence` tends to decrease.
2. **Data Skew:** The dataset is heavily skewed towards shorter target lengths and mid-to-high confidence scores.
3. **Increased Uncertainty:** The model's predictive trend (the regression line) becomes much less certain for longer target lengths, as shown by the widening confidence band.
4. **Outliers:** A few data points exist with very high confidence (>0.8) at low target lengths, and a few with very low confidence (<0.2) across various lengths, but they are not extreme outliers.
### Interpretation
This chart likely evaluates the performance of a machine learning or NLP model on a "world religions" task. The "Target Length" probably refers to the length (e.g., word count, token count) of an input query or text passage, while "Confidence" is the model's self-assessed probability or certainty in its output.
The data suggests the model is **less confident when processing longer, more complex inputs** related to world religions. This could indicate that the model's knowledge or reasoning ability degrades with input length for this specific domain, or that longer inputs introduce more ambiguity. The high density of data at shorter lengths implies the evaluation dataset or typical use case involves brief queries. The widening confidence interval for longer targets is a critical finding, signaling that the model's behavior becomes unpredictable and unreliable as input length grows, which is an important limitation to consider for real-world applications.