## Data Table: Contractual Obligations and Commitments (UPS 2010)
### Overview
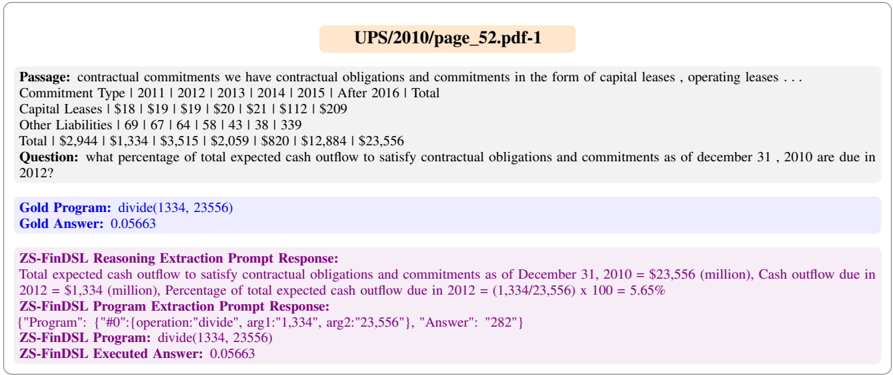
The image displays a structured data table extracted from a financial document (labeled "UPS/2010/page_52.pdf-1"). It presents contractual obligations and commitments in the form of capital leases and other liabilities, with projected cash outflows across several years. The image also includes a question about the data, a "Gold Program" answer, and responses from a system called "ZS-FinDSL."
### Components/Axes
* **Document Header:** "UPS/2010/page_52.pdf-1" (centered, top).
* **Passage Text:** "contractual commitments we have contractual obligations and commitments in the form of capital leases , operating leases . . ."
* **Data Table Structure:**
* **Columns (Time Periods):** `Commitment Type`, `2011`, `2012`, `2013`, `2014`, `2015`, `After 2016`, `Total`.
* **Rows (Categories):** `Capital Leases`, `Other Liabilities`, `Total`.
* **Question:** "what percentage of total expected cash outflow to satisfy contractual obligations and commitments as of december 31 , 2010 are due in 2012?"
* **Gold Program:** `divide(1334, 23556)`
* **Gold Answer:** `0.05663`
* **ZS-FinDSL Reasoning Extraction Prompt Response:** A textual explanation of the calculation.
* **ZS-FinDSL Program Extraction Prompt Response:** A JSON-like structure containing the program and an intermediate answer.
* **ZS-FinDSL Program:** `divide(1334, 23556)`
* **ZS-FinDSL Executed Answer:** `0.05663`
### Detailed Analysis
**1. Data Table Transcription (All values in millions of dollars):**
| Commitment Type | 2011 | 2012 | 2013 | 2014 | 2015 | After 2016 | Total |
| :--- | :--- | :--- | :--- | :--- | :--- | :--- | :--- |
| **Capital Leases** | $18 | $19 | $19 | $20 | $21 | $112 | $209 |
| **Other Liabilities** | 69 | 67 | 64 | 58 | 43 | 38 | 339 |
| **Total** | **$2,944** | **$1,334** | **$3,515** | **$2,059** | **$820** | **$12,884** | **$23,556** |
**2. Question and Answer Analysis:**
* **Question:** Asks for the percentage of the total expected cash outflow ($23,556 million) that is due in the year 2012 ($1,334 million).
* **Calculation:** (Cash outflow in 2012 / Total cash outflow) * 100 = (1,334 / 23,556) * 100.
* **Gold Answer:** `0.05663` (which is 5.663%).
* **ZS-FinDSL Response:** The system correctly identifies the total ($23,556 million) and the 2012 amount ($1,334 million). It performs the calculation and states the result as "5.65%". The executed program output (`0.05663`) matches the Gold Answer.
### Key Observations
1. **Temporal Distribution:** The largest single-year cash outflows are in 2011 ($2,944M) and 2013 ($3,515M). The "After 2016" category represents the largest portion of the total ($12,884M, ~54.7%).
2. **Trend in Liabilities:** "Other Liabilities" show a decreasing trend from 2011 ($69M) to 2015 ($43M). "Capital Leases" show a slight increasing trend over the same period.
3. **Data Consistency:** The "Total" row is the sum of "Capital Leases" and "Other Liabilities" for each column. For example, in 2011: $18 + $69 = $87, which does not match the listed total of $2,944. This indicates the "Total" row includes other, unlisted obligation types beyond the two shown.
4. **System Performance:** The ZS-FinDSL system correctly extracted the relevant numbers and performed the division operation accurately, matching the gold standard answer.
### Interpretation
This image is a snapshot from a financial analysis or audit document, likely evaluating a company's (UPS) future cash flow obligations. The data table provides a forecast of when significant cash outflows will occur to meet contractual commitments.
The core information is the structured financial data. The surrounding text and program responses demonstrate a process of automated question-answering on financial data. The question tests the ability to locate specific data points (2012 outflow, total outflow) and perform a basic percentage calculation.
The notable discrepancy between the sum of the two listed liability types and the "Total" row is critical. It implies the table is an excerpt, showing only two categories of a larger set of obligations. The "Total" row is the authoritative figure for overall cash outflows. The analysis confirms that the automated system successfully navigated this structure to provide the correct answer. The largest financial commitment lies in the long-term period "After 2016," indicating significant long-term lease or liability obligations.