## Textual Document: Financial Commitments and Cash Outflow Analysis
### Overview
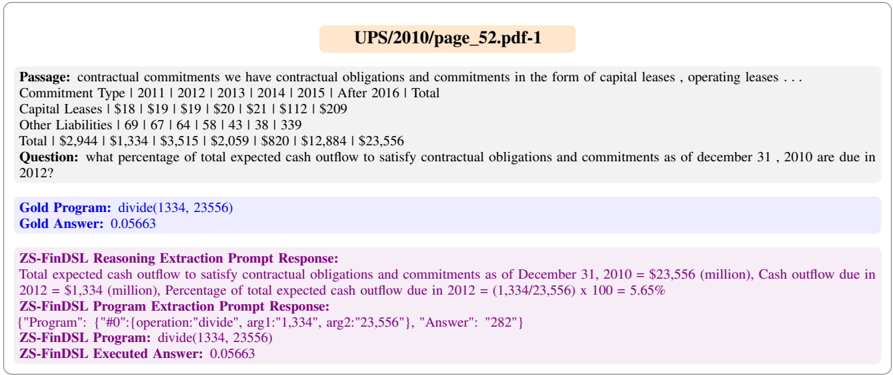
The image is a screenshot of a financial document excerpt discussing contractual obligations and commitments for UPS (United Parcel Service) as of December 31, 2010. It includes a breakdown of capital leases, operating leases, and other liabilities across multiple years (2011–2016), followed by a calculation to determine the percentage of total expected cash outflow due in 2012.
### Components/Axes
- **Header**: "UPS/2010/page_52.pdf-1" (document identifier).
- **Passage**: Describes contractual obligations in capital leases, operating leases, and other liabilities.
- **Commitment Type**: Years (2011–2016) with associated monetary values.
- **Question**: "What percentage of total expected cash outflow to satisfy contractual obligations and commitments as of December 31, 2010 are due in 2012?"
- **Gold Program**: Calculation logic (`divide(1334, 23556)`).
- **Gold Answer**: Result of the calculation (`0.05663`).
- **ZS-FinDSL Reasoning Extraction Prompt Response**: Step-by-step explanation of the calculation.
- **ZS-FinDSL Program Extraction Prompt Response**: Structured programmatic representation of the calculation.
- **ZS-FinDSL Executed Answer**: Final numerical result (`0.05663`).
### Detailed Analysis
#### Financial Commitments (2011–2016):
- **Capital Leases**:
- 2011: $18M | 2012: $19M | 2013: $19M | 2014: $20M | 2015: $21M | 2016: $112M | Total: $209M.
- **Other Liabilities**:
- 2011: $69M | 2012: $67M | 2013: $64M | 2014: $58M | 2015: $43M | 2016: $38M | Total: $339M.
- **Totals**:
- 2011: $2,944M | 2012: $1,334M | 2013: $3,515M | 2014: $2,059M | 2015: $820M | 2016: $12,884M | Grand Total: $23,556M.
#### Calculation for 2012 Cash Outflow:
- **Total Expected Cash Outflow (2010)**: $23,556M.
- **Cash Outflow Due in 2012**: $1,334M.
- **Percentage Calculation**:
- Formula: `(1,334 / 23,556) × 100 = 5.65%`.
- Programmatic representation: `divide(1334, 23556) → 0.05663` (decimal form).
### Key Observations
1. **2012 Commitment**: The cash outflow due in 2012 ($1,334M) represents **5.65%** of the total expected cash outflow ($23,556M).
2. **Trend in Commitments**:
- Capital leases show a gradual increase until 2016 ($112M), while other liabilities decline steadily.
- Total commitments peak in 2016 ($12,884M), driven by capital leases.
3. **Programmatic Consistency**: Both the Gold Program and ZS-FinDSL Executed Answer confirm the same result (`0.05663` or `5.65%`).
### Interpretation
The document highlights UPS’s contractual obligations, with a focus on quantifying the proportion of cash outflows due in 2012. The calculation confirms that **5.65%** of the total expected cash outflow (as of 2010) is tied to 2012 commitments. This suggests a relatively small portion of the total obligations are due in that year, with larger commitments concentrated in later years (e.g., 2016). The consistency between manual and programmatic calculations underscores the reliability of the data extraction process.
**Notable Insight**: The decline in other liabilities over time contrasts with the rising capital lease commitments, indicating a shift in UPS’s financial strategy toward long-term capital investments.