## Line Chart: GLM-4.7 (358B) Performance Analysis
### Overview
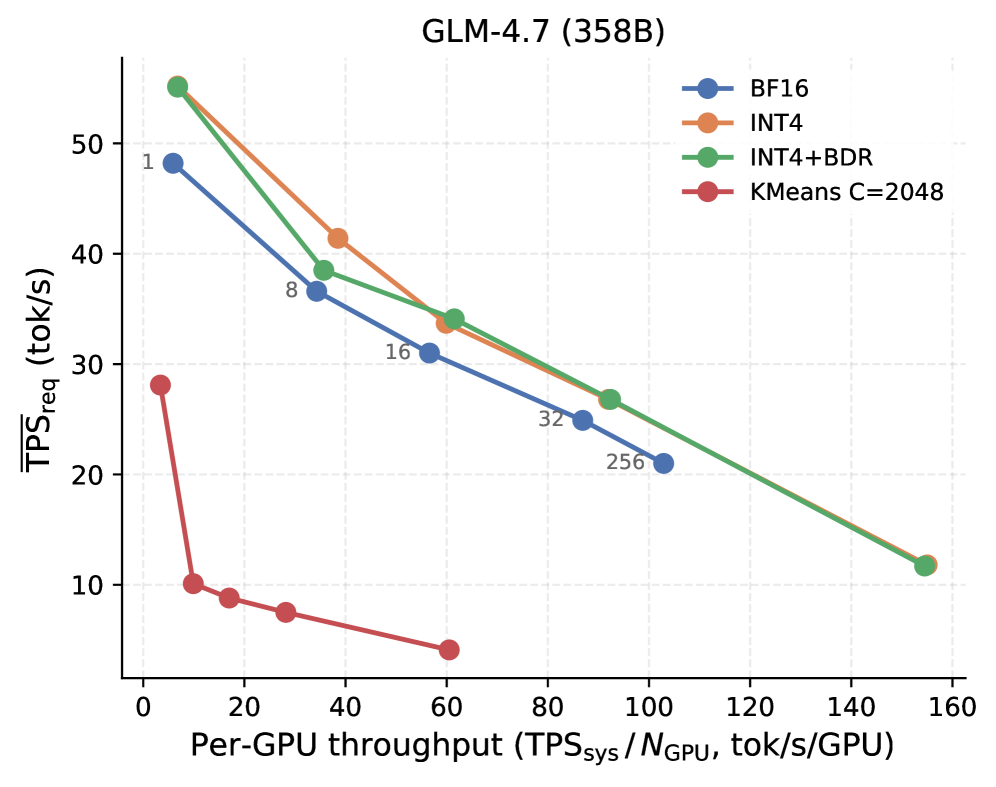
The chart compares the relationship between **Per-GPU throughput** (x-axis) and **TPS_req** (tokens per second, y-axis) for four different quantization methods applied to the GLM-4.7 (358B) model. Data is visualized as four distinct lines with unique markers and colors.
---
### Components/Axes
- **X-axis**:
Label: *"Per-GPU throughput (TPS_sys/N_GPU, tok/s/GPU)"*
Scale: 0 to 160 (logarithmic spacing between 1, 8, 16, 32, 256).
- **Y-axis**:
Label: *"TPS_req (tok/s)"*
Scale: 0 to 50 (linear increments of 10).
- **Legend**:
- **BF16**: Blue circles (●)
- **INT4**: Orange circles (●)
- **INT4+BDR**: Green circles (●)
- **KMeans C=2048**: Red squares (■)
Positioned in the top-right corner.
---
### Detailed Analysis
#### Data Series Trends
1. **BF16 (Blue ●)**:
- Starts at (1, 48) and decreases steadily to (256, 20).
- Slope: Gradual decline, maintaining a consistent rate of reduction.
2. **INT4 (Orange ●)**:
- Starts at (1, 55) and decreases to (256, 22).
- Slope: Slightly steeper than BF16, with a sharper drop between 16 and 32.
3. **INT4+BDR (Green ●)**:
- Starts at (1, 55) and decreases to (256, 22).
- Slope: Similar to INT4 but with a more pronounced decline after 32.
4. **KMeans C=2048 (Red ■)**:
- Starts at (1, 28) and drops sharply to (16, 5).
- Slope: Steepest decline, with a near-vertical drop between 1 and 16.
---
### Key Observations
- **INT4 and INT4+BDR** share identical starting points (1, 55) but diverge slightly at higher throughputs.
- **KMeans C=2048** exhibits the most aggressive reduction in TPS_req, suggesting higher efficiency but potentially lower accuracy (implied by the "C=2048" label).
- **BF16** maintains the highest TPS_req across all throughputs, indicating lower efficiency compared to other methods.
- All lines converge near (256, 20–22), suggesting diminishing returns at extreme throughputs.
---
### Interpretation
The chart demonstrates a trade-off between **quantization method** and **model efficiency**:
- **INT4 and INT4+BDR** balance throughput and TPS_req, offering moderate efficiency gains over BF16.
- **KMeans C=2048** achieves the lowest TPS_req but at the cost of reduced throughput (limited to 16 tok/s/GPU). This suggests it may prioritize precision over speed, possibly using a specialized compression technique (e.g., centroid-based clustering).
- The convergence at high throughputs implies that all methods plateau in performance beyond a certain point, highlighting hardware/software bottlenecks.
The data underscores the importance of selecting quantization strategies based on application-specific requirements (e.g., real-time inference vs. batch processing).