## Diagram: Image Generation Workflow
### Overview
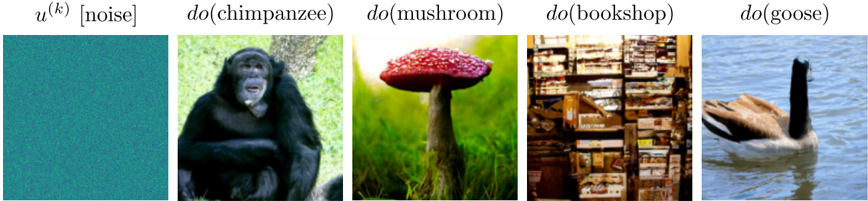
The image depicts a five-panel workflow illustrating the progression from noise to specific generated images. Each panel is labeled with a mathematical or functional notation, suggesting a computational or algorithmic process.
### Components/Axes
- **Panel 1**: Labeled `u^(k) [noise]` (teal square).
- **Panel 2**: Labeled `do(chimpanzee)` (image of a chimpanzee).
- **Panel 3**: Labeled `do(mushroom)` (image of a red mushroom).
- **Panel 4**: Labeled `do(bookshop)` (image of a cluttered bookshop).
- **Panel 5**: Labeled `do(goose)` (image of a goose in water).
### Detailed Analysis
1. **Panel 1 (`u^(k) [noise]`)**:
- A solid teal square with no discernible features, representing random noise.
- The notation `u^(k)` implies a variable or function dependent on an index `k`, common in iterative algorithms.
2. **Panel 2 (`do(chimpanzee)`)**:
- A realistic image of a chimpanzee sitting on grass.
- The `do()` function suggests an action or transformation applied to the noise input.
3. **Panel 3 (`do(mushroom)`)**:
- A red mushroom with white spots on a green background.
- The transformation from noise to a specific object (mushroom) indicates a targeted generation process.
4. **Panel 4 (`do(bookshop)`)**:
- A dense bookshelf filled with books, showing organized chaos.
- The complexity of the scene implies advanced image synthesis capabilities.
5. **Panel 5 (`do(goose)`)**:
- A goose swimming in water, with detailed feather textures and reflections.
- The realism of the image highlights the model's ability to generate lifelike scenes.
### Key Observations
- The workflow progresses from abstract noise (`u^(k)`) to concrete, semantically meaningful images.
- The `do()` function appears to conditionally generate images based on textual prompts (e.g., "chimpanzee," "bookshop").
- No numerical values or axes are present, as the focus is on categorical transformations.
### Interpretation
This diagram likely represents a generative adversarial network (GAN) or diffusion model workflow, where random noise (`u^(k)`) is iteratively refined (`k` as an iteration step) to produce specific images via a function `do()`. The labels suggest a step-by-step process:
1. Start with noise.
2. Apply `do()` with a semantic prompt to generate a target image.
The increasing complexity of the generated images (from simple objects like a mushroom to complex scenes like a bookshop) demonstrates the model's capacity to handle varying levels of semantic detail. The absence of intermediate steps implies the `do()` function may directly map noise to outputs using a learned latent space.
**Note**: No numerical data or trends are present; the diagram emphasizes categorical transformations rather than quantitative analysis.