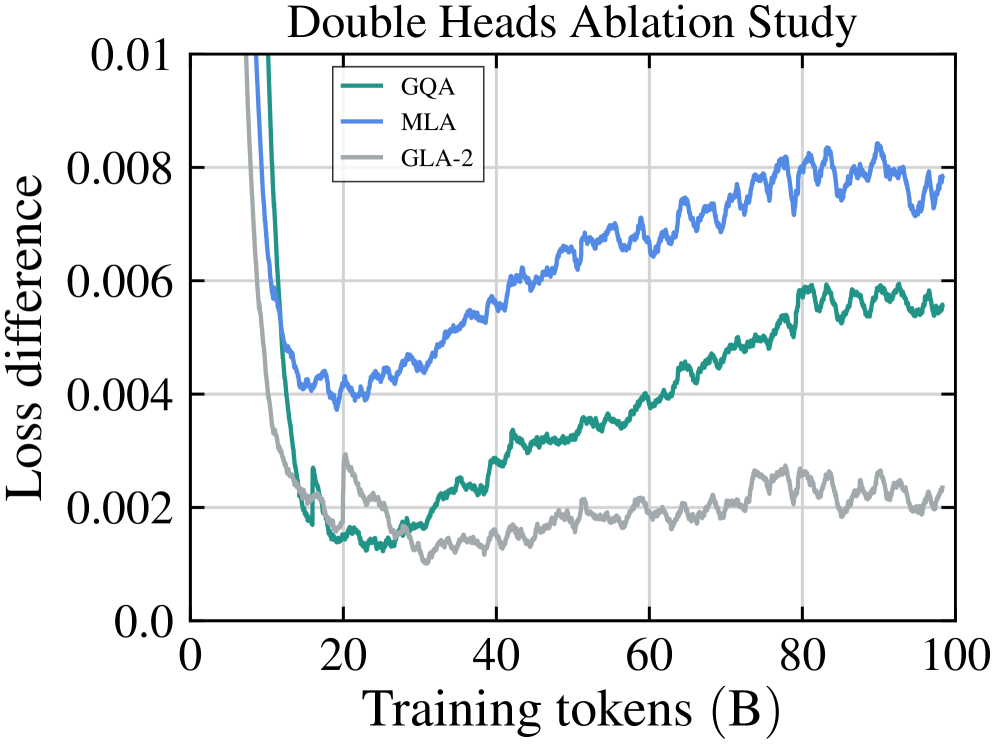
## Line Chart: Double Heads Ablation Study
### Overview
The chart compares the loss difference of three models (GQA, MLA, GLA-2) during training, measured across 100 billion training tokens. Loss difference is plotted on a logarithmic scale (0.000 to 0.01), with training tokens on a linear scale (0 to 100B). All three models show distinct trends in loss convergence.
### Components/Axes
- **X-axis**: Training tokens (B) – linear scale from 0 to 100B, marked at 20, 40, 60, 80, 100.
- **Y-axis**: Loss difference – logarithmic scale from 0.000 to 0.01, marked at 0.002, 0.004, 0.006, 0.008, 0.01.
- **Legend**: Located in the top-left corner, associating:
- Teal line: GQA
- Blue line: MLA
- Gray line: GLA-2
### Detailed Analysis
1. **GQA (Teal)**:
- Starts at ~0.01 loss difference at 0 tokens.
- Sharp decline to ~0.002 by 20 tokens.
- Gradual increase to ~0.006 by 100 tokens, with minor fluctuations.
2. **MLA (Blue)**:
- Begins at ~0.006 loss difference at 0 tokens.
- Decreases to ~0.004 by 20 tokens.
- Steady rise to ~0.008 by 100 tokens, with consistent oscillations.
3. **GLA-2 (Gray)**:
- Starts at ~0.004 loss difference at 0 tokens.
- Drops to ~0.002 by 20 tokens.
- Remains stable between 0.002–0.003 for the remainder of training.
### Key Observations
- **Initial Divergence**: GQA exhibits the highest initial loss but converges fastest (~0.002 by 20 tokens).
- **Long-term Behavior**: MLA shows the most significant late-stage increase in loss difference, suggesting potential overfitting or instability.
- **Stability**: GLA-2 maintains the lowest and most consistent loss difference after 20 tokens.
### Interpretation
The data suggests GLA-2 achieves the most stable training performance, with minimal loss difference fluctuations. MLA’s late-stage increase in loss difference may indicate suboptimal generalization, while GQA’s rapid early convergence followed by a rebound hints at possible architectural trade-offs. The logarithmic y-axis emphasizes early-stage differences, highlighting GQA’s initial superiority before plateauing. These trends could reflect differences in model architecture, optimization strategies, or regularization techniques.