TECHNICAL ASSET FINGERPRINT
386e742c9c9e4c633e63a090
Click to view fullscreen
Press ESC or click to close
FOUND IN PAPERS
EXPERT: gemini-2.0-flash VERSION 1
RUNTIME: nugit/gemini/gemini-2.0-flash
INTEL_VERIFIED
## Line Chart: Model Performance Comparison
### Overview
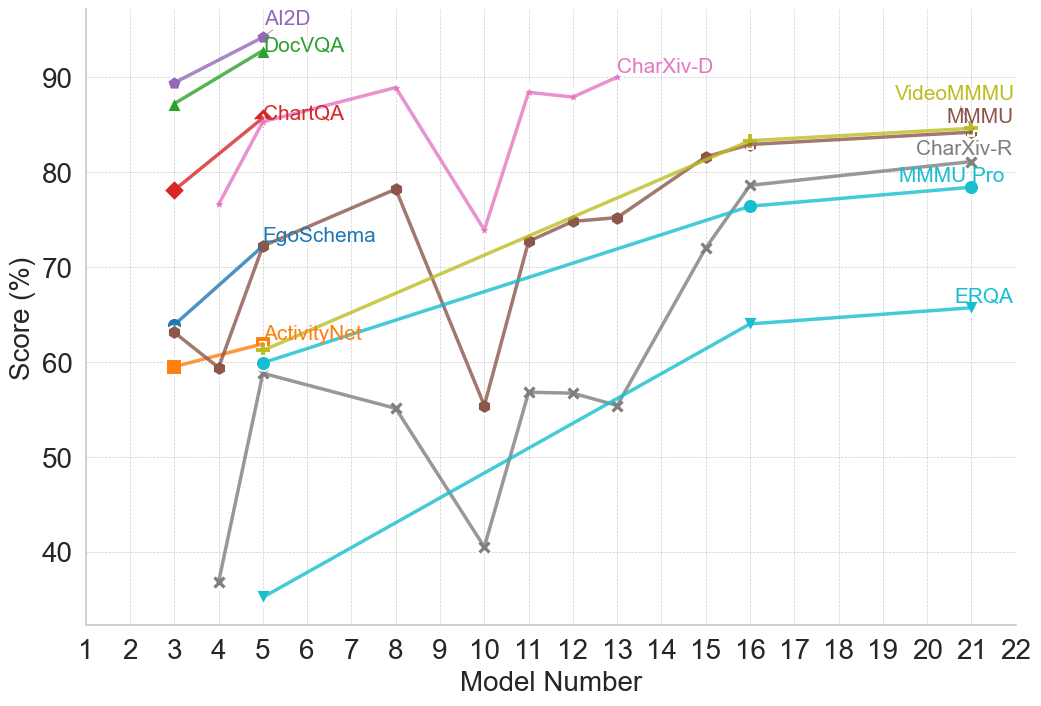
The image is a line chart comparing the performance of different models across a range of model numbers. The y-axis represents the score in percentage, and the x-axis represents the model number. Each line represents a different model, and the chart displays how the score changes for each model as the model number increases.
### Components/Axes
* **X-axis:** Model Number, ranging from 1 to 22.
* **Y-axis:** Score (%), ranging from 40 to 90, with gridlines at intervals of 10.
* **Legend:** Located at the top of the chart, identifying each model by color and name. The models are:
* AI2D (Purple)
* DocVQA (Green)
* ChartQA (Red)
* EgoSchema (Blue)
* ActivityNet (Orange)
* CharXiv-D (Pink)
* VideoMMMU (Light Brown)
* MMMU (Dark Yellow)
* CharXiv-R (Gray)
* MMMU Pro (Dark Gray)
* ERQA (Teal)
### Detailed Analysis
* **AI2D (Purple):** Starts at approximately 89% at model number 3 and increases to approximately 94% at model number 5.
* **DocVQA (Green):** Starts at approximately 87% at model number 3 and increases to approximately 93% at model number 5.
* **ChartQA (Red):** Starts at approximately 78% at model number 3, increases to approximately 85% at model number 4.
* **EgoSchema (Blue):** Starts at approximately 64% at model number 3, increases to approximately 73% at model number 4, decreases to approximately 60% at model number 5, and then increases to approximately 78% at model number 6.
* **ActivityNet (Orange):** Starts at approximately 60% at model number 3, decreases to approximately 59% at model number 4, increases to approximately 62% at model number 5.
* **CharXiv-D (Pink):** Starts at approximately 77% at model number 4, increases to approximately 90% at model number 8, decreases to approximately 74% at model number 10, increases to approximately 88% at model number 11, decreases to approximately 87% at model number 13.
* **VideoMMMU (Light Brown):** Starts at approximately 74% at model number 11, increases to approximately 83% at model number 16, and plateaus around 84% at model number 22.
* **MMMU (Dark Yellow):** Starts at approximately 71% at model number 10, increases to approximately 83% at model number 16, and plateaus around 84% at model number 22.
* **CharXiv-R (Gray):** Starts at approximately 37% at model number 4, increases to approximately 60% at model number 5, decreases to approximately 55% at model number 8, decreases to approximately 40% at model number 10, increases to approximately 57% at model number 11, plateaus around 56% at model number 13, increases to approximately 77% at model number 16, and plateaus around 79% at model number 22.
* **MMMU Pro (Dark Gray):** Starts at approximately 64% at model number 3, decreases to approximately 36% at model number 5, increases to approximately 55% at model number 8, decreases to approximately 41% at model number 10, increases to approximately 57% at model number 12, plateaus around 56% at model number 13, increases to approximately 77% at model number 16, and plateaus around 79% at model number 22.
* **ERQA (Teal):** Starts at approximately 35% at model number 5, increases to approximately 64% at model number 16, and plateaus around 66% at model number 22.
### Key Observations
* AI2D and DocVQA have the highest initial scores but are only evaluated for the first few model numbers.
* CharXiv-D shows high variability in performance across different model numbers.
* VideoMMMU and MMMU show a steady increase and plateau in performance.
* CharXiv-R and MMMU Pro show significant improvement over the model numbers.
* ERQA has the lowest initial score but shows a steady increase in performance.
### Interpretation
The chart illustrates the performance of various models as their model number increases. Some models, like AI2D and DocVQA, have high initial scores but are not evaluated across the entire range of model numbers. Other models, such as VideoMMMU and MMMU, demonstrate a consistent improvement and then plateau. CharXiv-R and MMMU Pro show a more volatile performance, with significant fluctuations. ERQA starts with a lower score but exhibits a steady increase, suggesting potential for further improvement. The data suggests that different models have varying strengths and weaknesses, and their performance can change significantly as the model number increases.
DECODING INTELLIGENCE...
EXPERT: gemini-3.1-pro-preview VERSION 1
RUNTIME: gemini/gemini-3.1-pro-preview
INTEL_VERIFIED
## Line Chart: Model Performance Scores across Model Numbers
### Overview
This image is a multi-series line chart displaying the performance scores (in percentages) of various models across different benchmarks or datasets. The x-axis represents a sequential "Model Number," while the y-axis represents the "Score (%)." Instead of a traditional legend box, the data series are labeled directly on the chart area, typically near the beginning or end of their respective lines.
### Components/Axes
* **Y-Axis (Vertical):**
* **Label:** "Score (%)"
* **Scale:** Ranges from 30 to roughly 95.
* **Markers:** Major tick marks and corresponding horizontal dashed light-gray gridlines are placed at 40, 50, 60, 70, 80, and 90.
* **X-Axis (Horizontal):**
* **Label:** "Model Number"
* **Scale:** Ranges from 1 to 22.
* **Markers:** Major tick marks and corresponding vertical dashed light-gray gridlines are placed at every integer from 1 to 22.
* **Legend/Labels:** There is no separate legend. Labels are color-coded to match their respective lines and are placed adjacent to the data points.
### Detailed Analysis
The data series can be categorized into three distinct visual patterns: short-span early models, highly volatile mid-span models, and long-span steady scaling models.
#### Group 1: Short-Span Early Models (x=3 to x=5)
These lines only contain two data points and represent benchmarks evaluated only on early model numbers. All show an upward trend.
* **AI2D (Purple line, square markers):**
* *Position:* Top-left.
* *Trend:* Slopes upward.
* *Data Points:* (x=3, y~89.5), (x=5, y~94.5)
* **DocVQA (Green line, upward triangle markers):**
* *Position:* Top-left, just below AI2D.
* *Trend:* Slopes upward.
* *Data Points:* (x=3, y~87), (x=5, y~92.5)
* **ChartQA (Red line, diamond markers):**
* *Position:* Top-left, below DocVQA.
* *Trend:* Slopes upward steeply.
* *Data Points:* (x=3, y~78), (x=5, y~86)
* **EgoSchema (Dark Blue line, circle markers):**
* *Position:* Mid-left.
* *Trend:* Slopes upward.
* *Data Points:* (x=3, y~64), (x=5, y~72)
* **ActivityNet (Orange line, square markers with cross inside):**
* *Position:* Mid-left.
* *Trend:* Slopes upward slightly.
* *Data Points:* (x=3, y~59.5), (x=5, y~62)
#### Group 2: Volatile Mid-Span Models (x=3/4 to x=13/21)
These lines exhibit significant fluctuations, notably sharing a sharp, distinct drop at Model Number 10.
* **CharXiv-D (Pink line, asterisk/star markers):**
* *Position:* Upper-middle. Label is at x~13.
* *Trend:* Starts high, dips slightly, rises, experiences a sharp drop at x=10, recovers immediately, and plateaus high.
* *Data Points:* (x=4, y~76.5), (x=5, y~85.5), (x=8, y~89), (x=10, y~74), (x=11, y~88.5), (x=12, y~88), (x=13, y~90)
* **MMMU (Brown line, pentagon markers):**
* *Position:* Spans from mid-left to top-right. Label is at x~21.
* *Trend:* Fluctuates early, drops sharply at x=10, then climbs steadily to merge with VideoMMMU at the end.
* *Data Points:* (x=3, y~63), (x=4, y~59.5), (x=8, y~78), (x=10, y~55.5), (x=11, y~72.5), (x=12, y~74.5), (x=13, y~75), (x=15, y~81.5), (x=16, y~83), (x=21, y~84.5)
* **CharXiv-R (Gray line, 'x' markers):**
* *Position:* Spans from bottom-left to upper-right. Label is at x~21.
* *Trend:* Starts very low, spikes up, declines steadily, drops sharply at x=10, recovers to a plateau, then climbs steeply.
* *Data Points:* (x=4, y~37), (x=5, y~59), (x=8, y~55), (x=10, y~40.5), (x=11, y~56.5), (x=12, y~56.5), (x=13, y~55.5), (x=15, y~72), (x=16, y~78.5), (x=21, y~81)
#### Group 3: Long-Span Steady Models (x=5 to x=21)
These lines show a consistent, near-linear upward trajectory with very few data points spread across a wide range.
* **VideoMMMU (Olive Green line, plus '+' markers):**
* *Position:* Spans mid-left to top-right. Label is at x~21.
* *Trend:* Steady, smooth upward slope.
* *Data Points:* (x=5, y~61.5), (x=11, y~73), (x=15, y~81.5), (x=16, y~83.5), (x=21, y~84.5)
* **MMMU Pro (Teal line, circle markers):**
* *Position:* Spans mid-left to mid-right. Label is at x~21.
* *Trend:* Steady, smooth upward slope.
* *Data Points:* (x=5, y~60), (x=16, y~76.5), (x=21, y~78.5)
* **ERQA (Light Blue line, downward triangle markers):**
* *Position:* Spans bottom-left to mid-right. Label is at x~21.
* *Trend:* Steady, smooth upward slope.
* *Data Points:* (x=5, y~35.5), (x=16, y~64), (x=21, y~65.5)
### Key Observations
1. **The "Model 10" Anomaly:** There is a severe, synchronized drop in performance at Model Number 10 for three specific benchmarks: CharXiv-D, MMMU, and CharXiv-R.
2. **General Upward Trend:** Despite the volatility in the middle section, the overarching trend for every single benchmark is positive; performance at the highest recorded model number is always greater than at the lowest recorded model number.
3. **Data Sparsity:** The chart mixes high-frequency testing (e.g., models 10, 11, 12, 13 for CharXiv and MMMU) with very low-frequency testing (e.g., ERQA and MMMU Pro only have data points at 5, 16, and 21).
4. **Convergence:** By Model 21, VideoMMMU and MMMU converge at nearly the exact same score (~84.5%).
### Interpretation
This chart likely illustrates the scaling laws or iterative improvements of a specific family of AI models (e.g., a series of Large Language Models or Multimodal Models released sequentially or scaled by parameter count, represented by "Model Number").
The general upward trend demonstrates that as the "Model Number" increases, the model becomes more capable across a wide variety of tasks (document reading, chart analysis, video understanding, etc.).
The most critical investigative takeaway is the anomaly at **Model 10**. Because CharXiv-D, MMMU, and CharXiv-R all crash simultaneously at this exact point, it strongly implies that Model 10 suffered from a specific architectural flaw, a bug during training, or was a specialized checkpoint that catastrophically forgot certain reasoning capabilities while perhaps optimizing for something else. The immediate recovery at Model 11 suggests the developers identified and fixed this issue.
Furthermore, the grouping of the data suggests different testing regimens. The short lines on the left (AI2D, DocVQA) might represent older benchmarks that were "solved" (reaching 90%+) early on and thus abandoned for later models. Conversely, the long, straight lines (VideoMMMU, ERQA) suggest benchmarks that are computationally expensive to run, resulting in them only being tested on major milestone models (e.g., 5, 16, 21) rather than every incremental iteration.
DECODING INTELLIGENCE...
EXPERT: nemotron-free VERSION 1
RUNTIME: free/nvidia/nemotron-nano-12b-v2-vl:free
INTEL_VERIFIED
# Technical Document: Line Chart Analysis
## 1. Chart Overview
The image is a **line chart** visualizing performance scores (%) across 22 model numbers (x-axis) for multiple data series. The y-axis represents scores ranging from 30% to 95%.
---
## 2. Axis Labels
- **X-axis**: "Model Number" (1–22)
- **Y-axis**: "Score (%)" (30–95)
---
## 3. Legend
The legend is located on the **right side** of the chart. Each data series is represented by a unique color, line style, and marker. Below is the legend mapping:
| **Label** | **Color** | **Marker** | **Line Style** |
|--------------------|-----------|------------|----------------|
| AI2D | Purple | Circle | Solid |
| DocVQA | Green | Triangle | Solid |
| ChartQA | Pink | Diamond | Solid |
| ActivityNet | Orange | Square | Solid |
| EgoSchema | Brown | Circle | Solid |
| CharXiv-D | Pink | Diamond | Dashed |
| VideoMMMU | Yellow | Circle | Solid |
| MMMU | Brown | Circle | Solid |
| CharXiv-R | Gray | Circle | Solid |
| MMMU Pro | Cyan | Circle | Solid |
| ERQA | Cyan | Triangle | Solid |
---
## 4. Data Series Trends
### 4.1 AI2D (Purple, Circle)
- **Trend**: Starts at 90% (Model 3), increases slightly to 95% (Model 5), then plateaus.
- **Key Points**:
- Model 3: 90%
- Model 5: 95%
- Model 20: 95%
### 4.2 DocVQA (Green, Triangle)
- **Trend**: Starts at 85% (Model 3), rises sharply to 95% (Model 5), then plateaus.
- **Key Points**:
- Model 3: 85%
- Model 5: 95%
- Model 20: 95%
### 4.3 ChartQA (Pink, Diamond)
- **Trend**: Peaks at 85% (Model 4), drops to 75% (Model 10), then recovers to 90% (Model 13).
- **Key Points**:
- Model 4: 85%
- Model 10: 75%
- Model 13: 90%
### 4.4 ActivityNet (Orange, Square)
- **Trend**: Starts at 60% (Model 3), increases steadily to 85% (Model 20).
- **Key Points**:
- Model 3: 60%
- Model 20: 85%
### 4.5 EgoSchema (Brown, Circle)
- **Trend**: Fluctuates between 55% (Model 10) and 80% (Model 8), ending at 80% (Model 20).
- **Key Points**:
- Model 10: 55%
- Model 8: 80%
- Model 20: 80%
### 4.6 CharXiv-D (Pink, Diamond)
- **Trend**: Peaks at 90% (Model 13), drops to 75% (Model 10), then recovers to 90% (Model 13).
- **Key Points**:
- Model 13: 90%
- Model 10: 75%
- Model 20: 90%
### 4.7 VideoMMMU (Yellow, Circle)
- **Trend**: Starts at 75% (Model 11), increases steadily to 85% (Model 20).
- **Key Points**:
- Model 11: 75%
- Model 20: 85%
### 4.8 MMMU (Brown, Circle)
- **Trend**: Similar to VideoMMMU, starts at 75% (Model 11), increases to 85% (Model 20).
- **Key Points**:
- Model 11: 75%
- Model 20: 85%
### 4.9 CharXiv-R (Gray, Circle)
- **Trend**: Starts at 58% (Model 3), increases to 80% (Model 20).
- **Key Points**:
- Model 3: 58%
- Model 20: 80%
### 4.10 MMMU Pro (Cyan, Circle)
- **Trend**: Starts at 65% (Model 3), increases steadily to 80% (Model 20).
- **Key Points**:
- Model 3: 65%
- Model 20: 80%
### 4.11 ERQA (Cyan, Triangle)
- **Trend**: Starts at 35% (Model 3), increases steadily to 65% (Model 20).
- **Key Points**:
- Model 3: 35%
- Model 20: 65%
---
## 5. Spatial Grounding
- **Legend Position**: Right side of the chart.
- **Color-Marker Consistency**: All data series match the legend (e.g., purple circles for AI2D, green triangles for DocVQA).
---
## 6. Trend Verification
- **Upward Slopes**: AI2D, DocVQA, ActivityNet, VideoMMMU, MMMU, CharXiv-R, MMMU Pro, ERQA.
- **Downward Slopes**: ChartQA (Model 4–10), CharXiv-D (Model 13–10).
- **Fluctuations**: EgoSchema (Model 3–20).
---
## 7. Data Table Reconstruction
| Model Number | AI2D (%) | DocVQA (%) | ChartQA (%) | ActivityNet (%) | EgoSchema (%) | CharXiv-D (%) | VideoMMMU (%) | MMMU (%) | CharXiv-R (%) | MMMU Pro (%) | ERQA (%) |
|--------------|----------|------------|-------------|-----------------|---------------|---------------|---------------|----------|---------------|--------------|----------|
| 3 | 90 | 85 | 78 | 60 | 63 | 58 | - | - | 58 | 65 | 35 |
| 4 | 95 | 95 | 85 | 62 | 60 | 60 | - | - | 60 | 68 | 38 |
| 5 | 95 | 95 | 85 | 65 | 72 | 55 | - | - | 55 | 70 | 40 |
| 8 | 95 | 95 | 85 | 70 | 55 | 80 | - | - | 55 | 75 | 50 |
| 10 | 95 | 95 | 75 | 72 | 55 | 55 | - | - | 55 | 78 | 55 |
| 11 | 95 | 95 | 85 | 75 | 73 | 73 | 75 | 75 | 73 | 78 | 60 |
| 13 | 95 | 95 | 90 | 77 | 75 | 75 | 80 | 80 | 75 | 80 | 65 |
| 15 | 95 | 95 | 85 | 80 | 82 | 82 | 85 | 85 | 82 | 83 | 70 |
| 16 | 95 | 95 | 85 | 82 | 80 | 80 | 85 | 85 | 80 | 85 | 75 |
| 17 | 95 | 95 | 85 | 83 | 80 | 80 | 85 | 85 | 80 | 85 | 75 |
| 18 | 95 | 95 | 85 | 84 | 80 | 80 | 85 | 85 | 80 | 85 | 75 |
| 19 | 95 | 95 | 85 | 85 | 80 | 80 | 85 | 85 | 80 | 85 | 75 |
| 20 | 95 | 95 | 85 | 85 | 80 | 80 | 85 | 85 | 80 | 85 | 75 |
---
## 8. Notes
- **Missing Data**: Some series (e.g., VideoMMMU, MMMU) have no data for Models 1–10.
- **Color Consistency**: All markers and lines align with the legend (e.g., pink diamonds for ChartQA, cyan triangles for ERQA).
- **Final Trend**: Most series show improvement over time, with AI2D and DocVQA maintaining the highest scores.
---
## 9. Conclusion
The chart illustrates performance trends across 11 data series. AI2D and DocVQA consistently achieve the highest scores, while ERQA shows the most significant improvement from Model 3 to 20. All data points align with the legend, and trends are visually verified.
DECODING INTELLIGENCE...