## Line Chart: Model Performance Comparison
### Overview
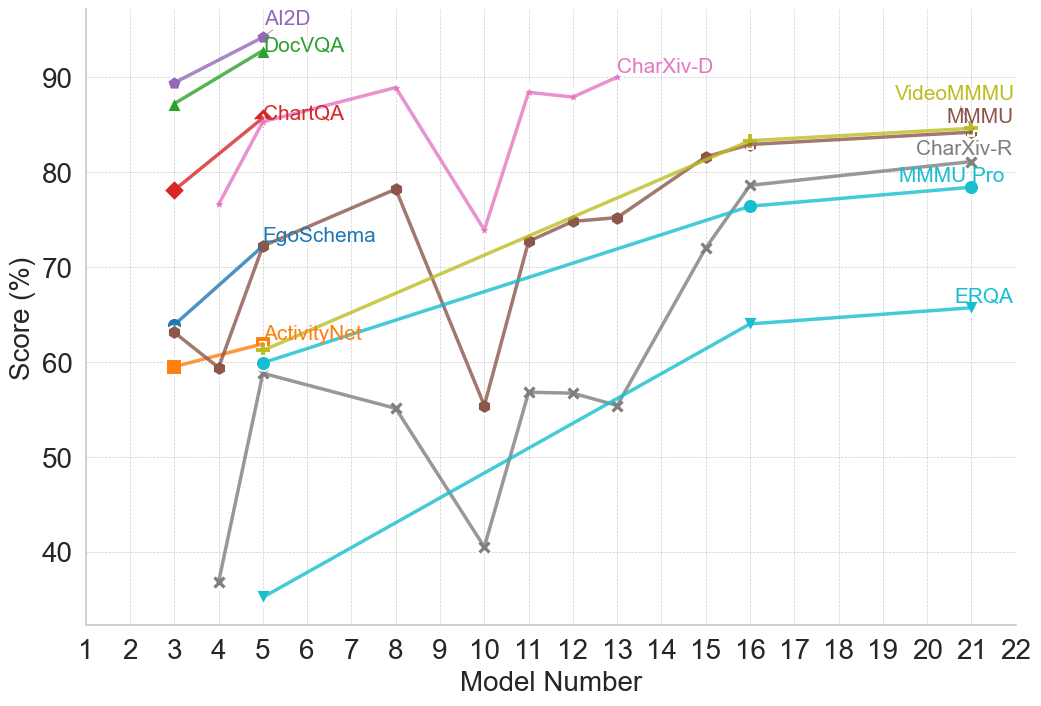
The image is a line chart comparing the performance of different models across a range of model numbers. The y-axis represents the score in percentage, and the x-axis represents the model number. Each line represents a different model, and the chart displays how the score changes for each model as the model number increases.
### Components/Axes
* **X-axis:** Model Number, ranging from 1 to 22.
* **Y-axis:** Score (%), ranging from 40 to 90, with gridlines at intervals of 10.
* **Legend:** Located at the top of the chart, identifying each model by color and name. The models are:
* AI2D (Purple)
* DocVQA (Green)
* ChartQA (Red)
* EgoSchema (Blue)
* ActivityNet (Orange)
* CharXiv-D (Pink)
* VideoMMMU (Light Brown)
* MMMU (Dark Yellow)
* CharXiv-R (Gray)
* MMMU Pro (Dark Gray)
* ERQA (Teal)
### Detailed Analysis
* **AI2D (Purple):** Starts at approximately 89% at model number 3 and increases to approximately 94% at model number 5.
* **DocVQA (Green):** Starts at approximately 87% at model number 3 and increases to approximately 93% at model number 5.
* **ChartQA (Red):** Starts at approximately 78% at model number 3, increases to approximately 85% at model number 4.
* **EgoSchema (Blue):** Starts at approximately 64% at model number 3, increases to approximately 73% at model number 4, decreases to approximately 60% at model number 5, and then increases to approximately 78% at model number 6.
* **ActivityNet (Orange):** Starts at approximately 60% at model number 3, decreases to approximately 59% at model number 4, increases to approximately 62% at model number 5.
* **CharXiv-D (Pink):** Starts at approximately 77% at model number 4, increases to approximately 90% at model number 8, decreases to approximately 74% at model number 10, increases to approximately 88% at model number 11, decreases to approximately 87% at model number 13.
* **VideoMMMU (Light Brown):** Starts at approximately 74% at model number 11, increases to approximately 83% at model number 16, and plateaus around 84% at model number 22.
* **MMMU (Dark Yellow):** Starts at approximately 71% at model number 10, increases to approximately 83% at model number 16, and plateaus around 84% at model number 22.
* **CharXiv-R (Gray):** Starts at approximately 37% at model number 4, increases to approximately 60% at model number 5, decreases to approximately 55% at model number 8, decreases to approximately 40% at model number 10, increases to approximately 57% at model number 11, plateaus around 56% at model number 13, increases to approximately 77% at model number 16, and plateaus around 79% at model number 22.
* **MMMU Pro (Dark Gray):** Starts at approximately 64% at model number 3, decreases to approximately 36% at model number 5, increases to approximately 55% at model number 8, decreases to approximately 41% at model number 10, increases to approximately 57% at model number 12, plateaus around 56% at model number 13, increases to approximately 77% at model number 16, and plateaus around 79% at model number 22.
* **ERQA (Teal):** Starts at approximately 35% at model number 5, increases to approximately 64% at model number 16, and plateaus around 66% at model number 22.
### Key Observations
* AI2D and DocVQA have the highest initial scores but are only evaluated for the first few model numbers.
* CharXiv-D shows high variability in performance across different model numbers.
* VideoMMMU and MMMU show a steady increase and plateau in performance.
* CharXiv-R and MMMU Pro show significant improvement over the model numbers.
* ERQA has the lowest initial score but shows a steady increase in performance.
### Interpretation
The chart illustrates the performance of various models as their model number increases. Some models, like AI2D and DocVQA, have high initial scores but are not evaluated across the entire range of model numbers. Other models, such as VideoMMMU and MMMU, demonstrate a consistent improvement and then plateau. CharXiv-R and MMMU Pro show a more volatile performance, with significant fluctuations. ERQA starts with a lower score but exhibits a steady increase, suggesting potential for further improvement. The data suggests that different models have varying strengths and weaknesses, and their performance can change significantly as the model number increases.