## Line Chart: Model Performance Comparison
### Overview
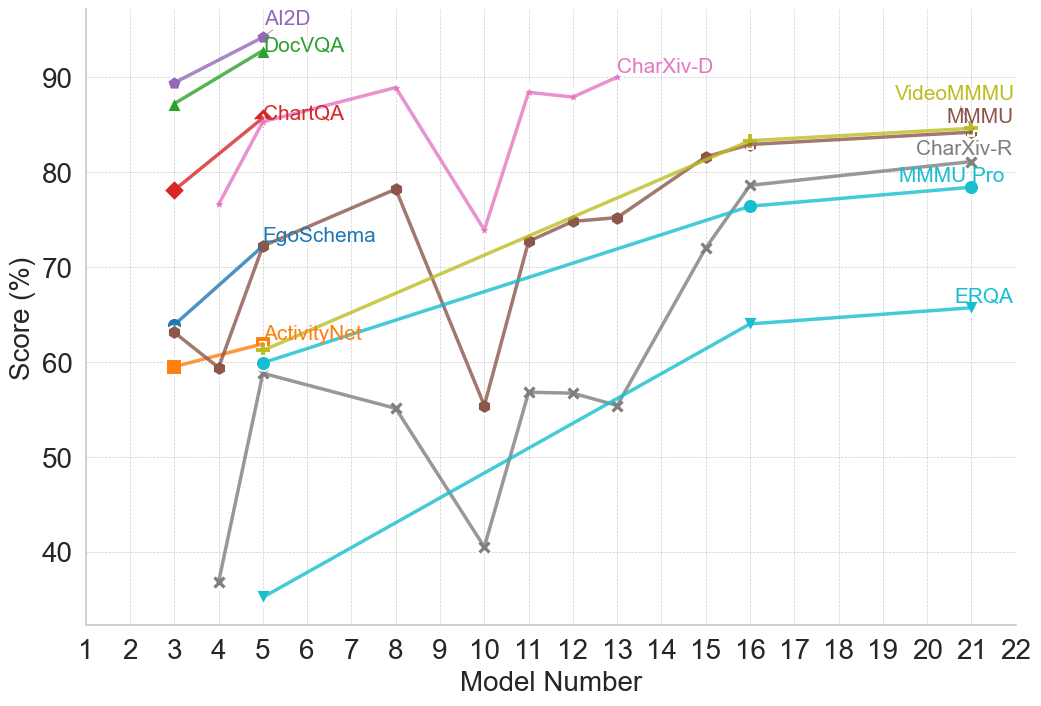
This line chart compares the performance scores (in percentage) of several models across a range of model numbers (1 to 22). The chart displays the performance trends of AI2D, DocVQA, ChartQA, EgoSchema, ActivityNet, CharXiv-D, VideoMMMU, MMMU, CharXiv-R, MMMU Pro, and ERQA.
### Components/Axes
* **X-axis:** Model Number (ranging from 1 to 22).
* **Y-axis:** Score (%) (ranging from 30% to 90%).
* **Legend:** Located in the top-right corner, identifies each line with a unique color and model name.
* AI2D (Purple)
* DocVQA (Gray)
* ChartQA (Red)
* EgoSchema (Light Blue)
* ActivityNet (Orange)
* CharXiv-D (Dark Green)
* VideoMMMU (Light Green)
* MMMU (Teal)
* CharXiv-R (Black)
* MMMU Pro (Brown)
* ERQA (Turquoise)
### Detailed Analysis
Here's a breakdown of each model's performance trend and approximate data points:
* **AI2D (Purple):** Starts at approximately 88% at Model 1, decreases slightly to around 85% at Model 3, then remains relatively stable around 85-90% until Model 18, then drops to approximately 80% at Model 22.
* **DocVQA (Gray):** Begins at approximately 85% at Model 1, declines sharply to around 40% at Model 5, then increases to approximately 55% at Model 9, and remains relatively stable around 55-65% until Model 22.
* **ChartQA (Red):** Starts at approximately 78% at Model 1, increases to a peak of around 88% at Model 4, then declines to approximately 75% at Model 9, and remains relatively stable around 75-80% until Model 22.
* **EgoSchema (Light Blue):** Starts at approximately 72% at Model 1, increases to around 78% at Model 3, then declines to approximately 65% at Model 7, and increases to around 75% at Model 16, then declines to approximately 70% at Model 22.
* **ActivityNet (Orange):** Begins at approximately 64% at Model 1, decreases to around 58% at Model 3, then increases to approximately 68% at Model 6, then declines to approximately 55% at Model 10, and remains relatively stable around 55-65% until Model 22.
* **CharXiv-D (Dark Green):** Starts at approximately 75% at Model 1, increases to a peak of around 85% at Model 14, then declines to approximately 80% at Model 22.
* **VideoMMMU (Light Green):** Starts at approximately 70% at Model 1, increases to around 80% at Model 16, then declines to approximately 75% at Model 22.
* **MMMU (Teal):** Begins at approximately 75% at Model 1, declines to around 65% at Model 5, then increases to approximately 78% at Model 16, and remains relatively stable around 78-80% until Model 22.
* **CharXiv-R (Black):** Starts at approximately 60% at Model 1, declines to around 35% at Model 5, then increases to approximately 55% at Model 10, and remains relatively stable around 55-60% until Model 22.
* **MMMU Pro (Brown):** Begins at approximately 75% at Model 1, declines to around 65% at Model 5, then increases to approximately 78% at Model 16, and remains relatively stable around 78-80% until Model 22.
* **ERQA (Turquoise):** Starts at approximately 60% at Model 1, increases to around 68% at Model 3, then declines to approximately 62% at Model 7, and remains relatively stable around 62-68% until Model 22.
### Key Observations
* AI2D consistently demonstrates the highest scores throughout most of the model range.
* DocVQA exhibits the most significant performance decline, particularly between Models 1 and 5.
* CharXiv-D shows a notable increase in performance around Model 14.
* Several models (MMMU, MMMU Pro, CharXiv-R) show similar performance trends.
* ActivityNet and ERQA have relatively stable, but lower, performance scores.
### Interpretation
The chart suggests that AI2D is the most robust model across the tested range, maintaining high performance regardless of the model number. DocVQA, while starting with a competitive score, suffers a substantial performance drop, indicating potential sensitivity to changes in the model. The convergence of performance scores for MMMU, MMMU Pro, and CharXiv-R suggests they may be utilizing similar underlying mechanisms or training data. The relatively stable performance of ActivityNet and ERQA indicates they may be less sensitive to model variations but also have lower overall performance ceilings. The peak in CharXiv-D's performance at Model 14 could indicate a specific optimization or architectural improvement implemented at that stage. Overall, the chart provides a comparative analysis of model performance, highlighting strengths and weaknesses of each model across a spectrum of model numbers. The data suggests that model number impacts performance, and different models respond to these changes in different ways.