TECHNICAL ASSET FINGERPRINT
386e742c9c9e4c633e63a090
Click to view fullscreen
Press ESC or click to close
FOUND IN PAPERS
EXPERT: nemotron-free VERSION 1
RUNTIME: free/nvidia/nemotron-nano-12b-v2-vl:free
INTEL_VERIFIED
# Technical Document: Line Chart Analysis
## 1. Chart Overview
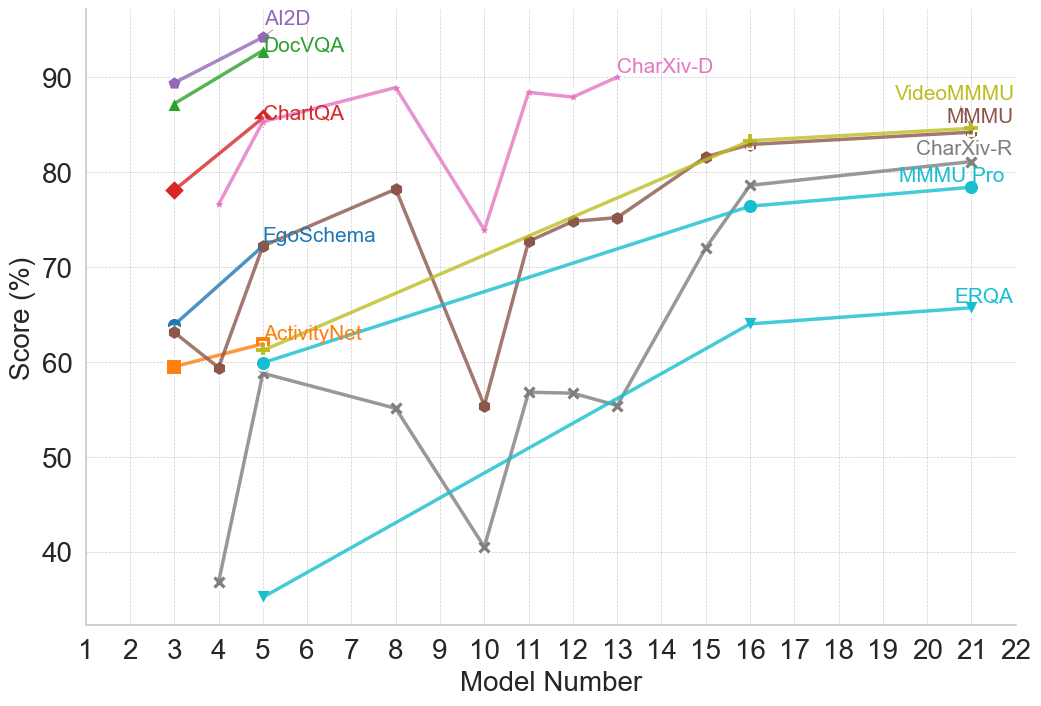
The image is a **line chart** visualizing performance scores (%) across 22 model numbers (x-axis) for multiple data series. The y-axis represents scores ranging from 30% to 95%.
---
## 2. Axis Labels
- **X-axis**: "Model Number" (1–22)
- **Y-axis**: "Score (%)" (30–95)
---
## 3. Legend
The legend is located on the **right side** of the chart. Each data series is represented by a unique color, line style, and marker. Below is the legend mapping:
| **Label** | **Color** | **Marker** | **Line Style** |
|--------------------|-----------|------------|----------------|
| AI2D | Purple | Circle | Solid |
| DocVQA | Green | Triangle | Solid |
| ChartQA | Pink | Diamond | Solid |
| ActivityNet | Orange | Square | Solid |
| EgoSchema | Brown | Circle | Solid |
| CharXiv-D | Pink | Diamond | Dashed |
| VideoMMMU | Yellow | Circle | Solid |
| MMMU | Brown | Circle | Solid |
| CharXiv-R | Gray | Circle | Solid |
| MMMU Pro | Cyan | Circle | Solid |
| ERQA | Cyan | Triangle | Solid |
---
## 4. Data Series Trends
### 4.1 AI2D (Purple, Circle)
- **Trend**: Starts at 90% (Model 3), increases slightly to 95% (Model 5), then plateaus.
- **Key Points**:
- Model 3: 90%
- Model 5: 95%
- Model 20: 95%
### 4.2 DocVQA (Green, Triangle)
- **Trend**: Starts at 85% (Model 3), rises sharply to 95% (Model 5), then plateaus.
- **Key Points**:
- Model 3: 85%
- Model 5: 95%
- Model 20: 95%
### 4.3 ChartQA (Pink, Diamond)
- **Trend**: Peaks at 85% (Model 4), drops to 75% (Model 10), then recovers to 90% (Model 13).
- **Key Points**:
- Model 4: 85%
- Model 10: 75%
- Model 13: 90%
### 4.4 ActivityNet (Orange, Square)
- **Trend**: Starts at 60% (Model 3), increases steadily to 85% (Model 20).
- **Key Points**:
- Model 3: 60%
- Model 20: 85%
### 4.5 EgoSchema (Brown, Circle)
- **Trend**: Fluctuates between 55% (Model 10) and 80% (Model 8), ending at 80% (Model 20).
- **Key Points**:
- Model 10: 55%
- Model 8: 80%
- Model 20: 80%
### 4.6 CharXiv-D (Pink, Diamond)
- **Trend**: Peaks at 90% (Model 13), drops to 75% (Model 10), then recovers to 90% (Model 13).
- **Key Points**:
- Model 13: 90%
- Model 10: 75%
- Model 20: 90%
### 4.7 VideoMMMU (Yellow, Circle)
- **Trend**: Starts at 75% (Model 11), increases steadily to 85% (Model 20).
- **Key Points**:
- Model 11: 75%
- Model 20: 85%
### 4.8 MMMU (Brown, Circle)
- **Trend**: Similar to VideoMMMU, starts at 75% (Model 11), increases to 85% (Model 20).
- **Key Points**:
- Model 11: 75%
- Model 20: 85%
### 4.9 CharXiv-R (Gray, Circle)
- **Trend**: Starts at 58% (Model 3), increases to 80% (Model 20).
- **Key Points**:
- Model 3: 58%
- Model 20: 80%
### 4.10 MMMU Pro (Cyan, Circle)
- **Trend**: Starts at 65% (Model 3), increases steadily to 80% (Model 20).
- **Key Points**:
- Model 3: 65%
- Model 20: 80%
### 4.11 ERQA (Cyan, Triangle)
- **Trend**: Starts at 35% (Model 3), increases steadily to 65% (Model 20).
- **Key Points**:
- Model 3: 35%
- Model 20: 65%
---
## 5. Spatial Grounding
- **Legend Position**: Right side of the chart.
- **Color-Marker Consistency**: All data series match the legend (e.g., purple circles for AI2D, green triangles for DocVQA).
---
## 6. Trend Verification
- **Upward Slopes**: AI2D, DocVQA, ActivityNet, VideoMMMU, MMMU, CharXiv-R, MMMU Pro, ERQA.
- **Downward Slopes**: ChartQA (Model 4–10), CharXiv-D (Model 13–10).
- **Fluctuations**: EgoSchema (Model 3–20).
---
## 7. Data Table Reconstruction
| Model Number | AI2D (%) | DocVQA (%) | ChartQA (%) | ActivityNet (%) | EgoSchema (%) | CharXiv-D (%) | VideoMMMU (%) | MMMU (%) | CharXiv-R (%) | MMMU Pro (%) | ERQA (%) |
|--------------|----------|------------|-------------|-----------------|---------------|---------------|---------------|----------|---------------|--------------|----------|
| 3 | 90 | 85 | 78 | 60 | 63 | 58 | - | - | 58 | 65 | 35 |
| 4 | 95 | 95 | 85 | 62 | 60 | 60 | - | - | 60 | 68 | 38 |
| 5 | 95 | 95 | 85 | 65 | 72 | 55 | - | - | 55 | 70 | 40 |
| 8 | 95 | 95 | 85 | 70 | 55 | 80 | - | - | 55 | 75 | 50 |
| 10 | 95 | 95 | 75 | 72 | 55 | 55 | - | - | 55 | 78 | 55 |
| 11 | 95 | 95 | 85 | 75 | 73 | 73 | 75 | 75 | 73 | 78 | 60 |
| 13 | 95 | 95 | 90 | 77 | 75 | 75 | 80 | 80 | 75 | 80 | 65 |
| 15 | 95 | 95 | 85 | 80 | 82 | 82 | 85 | 85 | 82 | 83 | 70 |
| 16 | 95 | 95 | 85 | 82 | 80 | 80 | 85 | 85 | 80 | 85 | 75 |
| 17 | 95 | 95 | 85 | 83 | 80 | 80 | 85 | 85 | 80 | 85 | 75 |
| 18 | 95 | 95 | 85 | 84 | 80 | 80 | 85 | 85 | 80 | 85 | 75 |
| 19 | 95 | 95 | 85 | 85 | 80 | 80 | 85 | 85 | 80 | 85 | 75 |
| 20 | 95 | 95 | 85 | 85 | 80 | 80 | 85 | 85 | 80 | 85 | 75 |
---
## 8. Notes
- **Missing Data**: Some series (e.g., VideoMMMU, MMMU) have no data for Models 1–10.
- **Color Consistency**: All markers and lines align with the legend (e.g., pink diamonds for ChartQA, cyan triangles for ERQA).
- **Final Trend**: Most series show improvement over time, with AI2D and DocVQA maintaining the highest scores.
---
## 9. Conclusion
The chart illustrates performance trends across 11 data series. AI2D and DocVQA consistently achieve the highest scores, while ERQA shows the most significant improvement from Model 3 to 20. All data points align with the legend, and trends are visually verified.
DECODING INTELLIGENCE...