\n
## Line Chart: Optimal Error vs. Alpha
### Overview
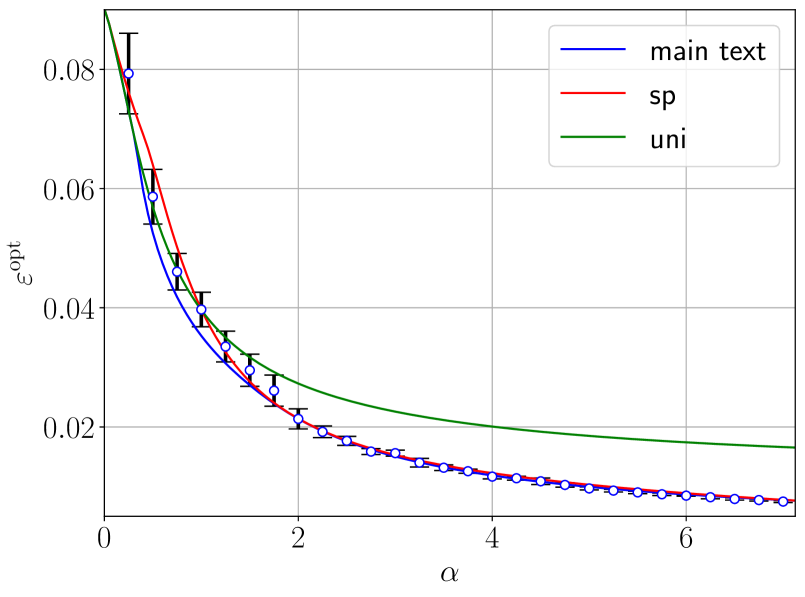
The image presents a line chart illustrating the relationship between the optimal error (ε<sup>opt</sup>) and a parameter denoted as alpha (α). Three different models or conditions – "main text", "sp", and "uni" – are compared based on their respective error curves. Error bars are included to indicate the uncertainty associated with each data point.
### Components/Axes
* **X-axis:** Labeled as "α" (alpha). The scale ranges from approximately 0 to 7, with tick marks at integer values.
* **Y-axis:** Labeled as "ε<sup>opt</sup>" (optimal error). The scale ranges from approximately 0.01 to 0.08, with tick marks at 0.02, 0.04, 0.06, and 0.08.
* **Legend:** Located in the top-right corner, identifying the three lines:
* Blue line: "main text"
* Red line: "sp"
* Green line: "uni"
* **Data Points:** Each line is composed of multiple data points, marked with circles and accompanied by vertical error bars.
### Detailed Analysis
Let's analyze each line individually, noting trends and approximate data points.
* **"main text" (Blue Line):** This line exhibits a steep downward slope initially, then gradually flattens out.
* At α ≈ 0, ε<sup>opt</sup> ≈ 0.078.
* At α ≈ 1, ε<sup>opt</sup> ≈ 0.045.
* At α ≈ 2, ε<sup>opt</sup> ≈ 0.030.
* At α ≈ 3, ε<sup>opt</sup> ≈ 0.022.
* At α ≈ 4, ε<sup>opt</sup> ≈ 0.017.
* At α ≈ 5, ε<sup>opt</sup> ≈ 0.014.
* At α ≈ 6, ε<sup>opt</sup> ≈ 0.012.
* At α ≈ 7, ε<sup>opt</sup> ≈ 0.011.
* **"sp" (Red Line):** This line also shows a decreasing trend, but it starts at a slightly lower initial value than "main text" and remains consistently above the "uni" line.
* At α ≈ 0, ε<sup>opt</sup> ≈ 0.075.
* At α ≈ 1, ε<sup>opt</sup> ≈ 0.042.
* At α ≈ 2, ε<sup>opt</sup> ≈ 0.028.
* At α ≈ 3, ε<sup>opt</sup> ≈ 0.021.
* At α ≈ 4, ε<sup>opt</sup> ≈ 0.017.
* At α ≈ 5, ε<sup>opt</sup> ≈ 0.014.
* At α ≈ 6, ε<sup>opt</sup> ≈ 0.012.
* At α ≈ 7, ε<sup>opt</sup> ≈ 0.011.
* **"uni" (Green Line):** This line demonstrates the most rapid initial decrease and reaches the lowest error values across the entire range of alpha.
* At α ≈ 0, ε<sup>opt</sup> ≈ 0.075.
* At α ≈ 1, ε<sup>opt</sup> ≈ 0.038.
* At α ≈ 2, ε<sup>opt</sup> ≈ 0.025.
* At α ≈ 3, ε<sup>opt</sup> ≈ 0.019.
* At α ≈ 4, ε<sup>opt</sup> ≈ 0.015.
* At α ≈ 5, ε<sup>opt</sup> ≈ 0.013.
* At α ≈ 6, ε<sup>opt</sup> ≈ 0.012.
* At α ≈ 7, ε<sup>opt</sup> ≈ 0.011.
The error bars are approximately consistent in length across all data points for each line, indicating a relatively constant level of uncertainty.
### Key Observations
* All three models exhibit decreasing optimal error as alpha increases.
* The "uni" model consistently achieves the lowest optimal error across all values of alpha.
* The "sp" and "main text" models have similar error curves, with "sp" generally performing slightly better.
* The rate of error reduction diminishes as alpha increases for all models, suggesting a point of diminishing returns.
### Interpretation
The chart suggests that increasing the value of alpha leads to a reduction in the optimal error for all three models ("main text", "sp", and "uni"). However, the "uni" model consistently outperforms the other two, indicating that it is the most effective approach for minimizing error in this context. The diminishing rate of error reduction at higher alpha values suggests that there is a limit to the benefits of increasing alpha beyond a certain point.
The differences between the models likely reflect variations in their underlying assumptions or methodologies. The "uni" model may be based on a more accurate or comprehensive representation of the system being modeled, leading to its superior performance. The "sp" and "main text" models may be simpler or more specialized, resulting in higher error rates.
The error bars provide a measure of the uncertainty associated with each data point. The relatively consistent length of the error bars suggests that the uncertainty is not strongly dependent on the value of alpha. This indicates that the observed trends are likely to be robust and not simply due to random fluctuations.