## Line Chart: Optimal Error (ε_opt) vs. Parameter α
### Overview
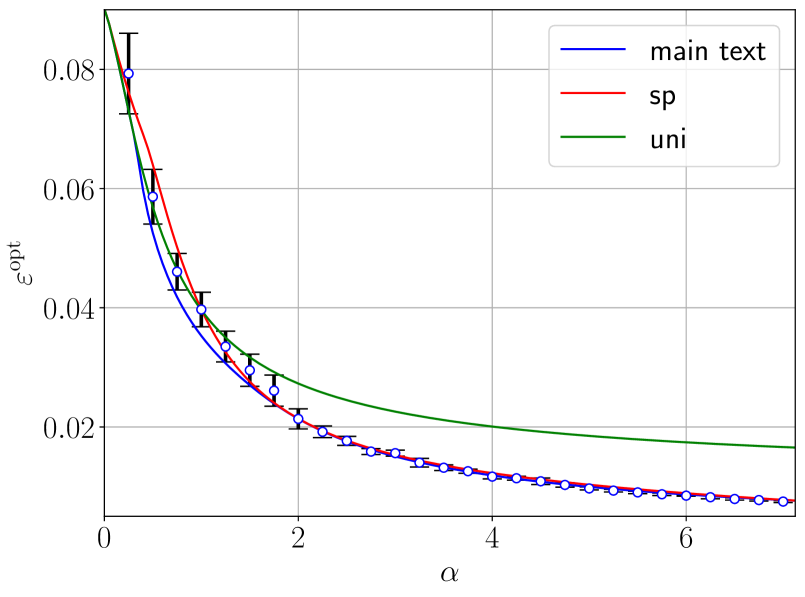
This is a line chart plotting the optimal error, denoted as ε_opt, against a parameter labeled α. The chart compares three different data series or methods, each represented by a distinct colored line. The general trend for all series is a decreasing, convex curve, where ε_opt decreases as α increases. The chart includes error bars for two of the series, indicating variability or uncertainty in the measurements.
### Components/Axes
* **X-Axis (Horizontal):**
* **Label:** α (alpha)
* **Scale:** Linear scale.
* **Major Tick Markers:** 0, 2, 4, 6. The axis extends slightly beyond 6.
* **Y-Axis (Vertical):**
* **Label:** ε_opt (epsilon sub opt)
* **Scale:** Linear scale.
* **Major Tick Markers:** 0.02, 0.04, 0.06, 0.08.
* **Legend:**
* **Position:** Top-right corner of the plot area.
* **Entries:**
1. **Blue Line:** "main text"
2. **Red Line:** "sp"
3. **Green Line:** "uni"
* **Grid:** A light gray grid is present, aligned with the major tick marks on both axes.
### Detailed Analysis
**1. Data Series "main text" (Blue Line with Circle Markers and Error Bars):**
* **Trend:** Steeply decreasing from α=0 to α≈2, then decreasing more gradually. The line appears to approach an asymptote near ε_opt ≈ 0.01 as α increases towards 6.
* **Key Data Points (Approximate):**
* At α ≈ 0.1: ε_opt ≈ 0.080 (with a large error bar from ~0.072 to ~0.088).
* At α ≈ 0.5: ε_opt ≈ 0.058.
* At α ≈ 1.0: ε_opt ≈ 0.040.
* At α ≈ 2.0: ε_opt ≈ 0.022.
* At α ≈ 4.0: ε_opt ≈ 0.013.
* At α ≈ 6.0: ε_opt ≈ 0.010.
* **Error Bars:** The vertical error bars are most pronounced at low α values (e.g., α < 1) and become progressively smaller as α increases, indicating reduced uncertainty for larger α.
**2. Data Series "sp" (Red Line with Plus Markers and Error Bars):**
* **Trend:** Follows a very similar decreasing, convex trend to the "main text" series. It is generally positioned slightly above the blue line for α < 2 and converges with it for α > 2.
* **Key Data Points (Approximate):**
* At α ≈ 0.1: ε_opt ≈ 0.082 (error bar from ~0.074 to ~0.090).
* At α ≈ 0.5: ε_opt ≈ 0.062.
* At α ≈ 1.0: ε_opt ≈ 0.043.
* At α ≈ 2.0: ε_opt ≈ 0.023.
* At α ≈ 4.0: ε_opt ≈ 0.013.
* At α ≈ 6.0: ε_opt ≈ 0.010.
* **Error Bars:** Similar pattern to the blue series: large at low α, diminishing as α increases.
**3. Data Series "uni" (Green Smooth Line):**
* **Trend:** A smooth, decreasing convex curve without markers or error bars. It starts at a similar point to the other series at α=0 but decays more slowly, remaining consistently above both the blue and red lines for all α > 0.
* **Key Data Points (Approximate):**
* At α = 0: ε_opt ≈ 0.085.
* At α ≈ 1.0: ε_opt ≈ 0.048.
* At α ≈ 2.0: ε_opt ≈ 0.030.
* At α ≈ 4.0: ε_opt ≈ 0.020.
* At α ≈ 6.0: ε_opt ≈ 0.017.
### Key Observations
1. **Converging Performance:** The "main text" (blue) and "sp" (red) methods show very similar performance, especially for α > 2, where their lines nearly overlap. Their error bars also overlap significantly throughout the range.
2. **Divergent Baseline:** The "uni" (green) method serves as a baseline or alternative that performs worse (higher ε_opt) than the other two methods across the entire plotted range of α > 0.
3. **Diminishing Returns:** All curves show a "law of diminishing returns" – the reduction in ε_opt per unit increase in α is greatest at small α and becomes minimal at large α.
4. **Uncertainty Pattern:** The uncertainty (error bar size) in the "main text" and "sp" measurements is inversely related to α, being highest when α is small.
### Interpretation
This chart likely illustrates the optimization of an error metric (ε_opt) with respect to a control parameter (α) in a computational or statistical model. The "main text" and "sp" represent two proposed or analyzed methods, while "uni" may represent a uniform or naive baseline approach.
The data suggests that both the "main text" and "sp" methods are effective at reducing the optimal error as α increases, significantly outperforming the "uni" baseline. The near-identical performance of "main text" and "sp" for α > 2 implies that the choice between these two methods may be inconsequential in that regime, or that they converge to the same solution. The larger error bars at low α indicate that the system's performance is more volatile or sensitive to initial conditions when the parameter α is small. The overall convex, decreasing shape is characteristic of many optimization and learning curves, where initial gains are rapid but further improvement requires increasingly larger adjustments to the parameter α.