## Line Graph: ε_opt vs α for Different Models
### Overview
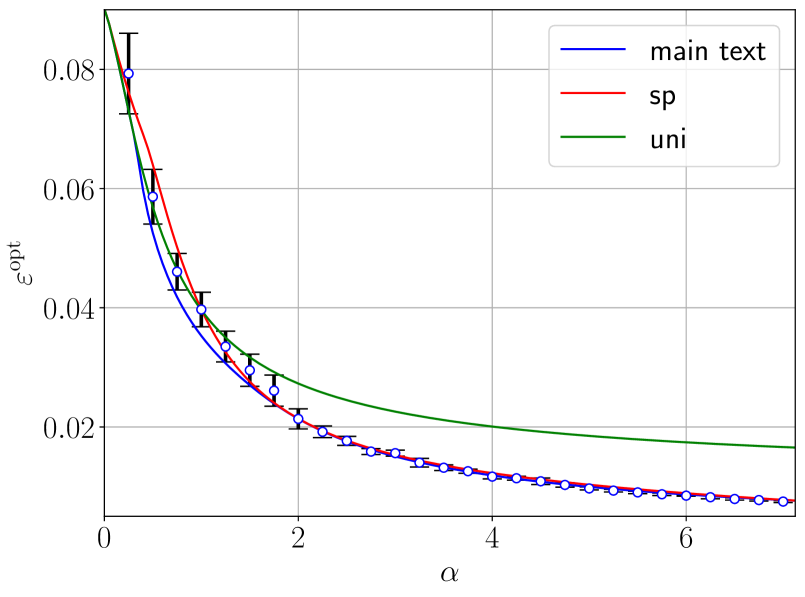
The graph depicts the relationship between the parameter α (x-axis) and the optimal error rate ε_opt (y-axis) for three distinct models: "main text" (blue), "sp" (red), and "uni" (green). All three models show a decreasing trend in ε_opt as α increases, with the "uni" model consistently exhibiting the highest ε_opt values.
### Components/Axes
- **X-axis (α)**: Ranges from 0 to 6 in increments of 1. No explicit units provided.
- **Y-axis (ε_opt)**: Ranges from 0 to 0.08 in increments of 0.02. Represents optimal error rate.
- **Legend**: Located in the top-right corner, associating:
- Blue line: "main text"
- Red line: "sp"
- Green line: "uni"
- **Data Points**: Blue line includes error bars (vertical black lines with caps) at specific α values.
### Detailed Analysis
1. **Initial Values (α = 0)**:
- All three models start at ε_opt ≈ 0.08.
- Blue ("main text") and red ("sp") lines overlap exactly at this point.
- Green ("uni") line begins slightly higher (~0.082).
2. **Trend Behavior**:
- **Blue ("main text")**:
- Data points plotted at α = 0, 0.5, 1, 1.5, 2, 2.5, 3, 3.5, 4, 4.5, 5, 5.5, 6.
- Error bars decrease in magnitude as α increases (e.g., ±0.005 at α=0 vs. ±0.001 at α=6).
- Final value at α=6: ε_opt ≈ 0.008.
- **Red ("sp")**:
- Smooth curve closely follows blue line but remains ~0.002 higher throughout.
- Final value at α=6: ε_opt ≈ 0.010.
- **Green ("uni")**:
- Smooth curve maintains the highest ε_opt across all α values.
- Final value at α=6: ε_opt ≈ 0.018.
3. **Convergence**:
- Blue and red lines converge near α=4, with ε_opt differences <0.003.
- Green line remains ~0.008 higher than blue/red at α=6.
### Key Observations
- All models show diminishing returns in ε_opt reduction as α increases.
- "uni" model consistently underperforms (higher ε_opt) compared to "main text" and "sp".
- Error bars on "main text" suggest decreasing measurement uncertainty with higher α.
- Red ("sp") and blue ("main text") lines exhibit near-identical trends after α=2.
### Interpretation
The graph demonstrates that increasing α improves ε_opt for all models, with "main text" and "sp" achieving similar performance at higher α values. The "uni" model's persistent ε_opt advantage suggests inherent limitations or different optimization constraints. The convergence of "main text" and "sp" lines implies potential equivalence in their underlying mechanisms at larger α scales. Error bar reduction in "main text" data points indicates improved reliability of measurements as α increases, possibly reflecting stabilized system behavior.