# Technical Analysis of Entity Frequency Distribution Chart
## Chart Overview
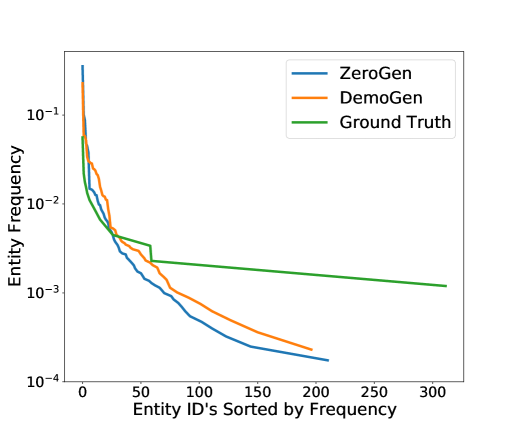
The image depicts a semi-logarithmic line chart comparing entity frequency distributions across three datasets: ZeroGen, DemoGen, and Ground Truth. The x-axis represents entity IDs sorted by frequency, while the y-axis shows entity frequency on a logarithmic scale.
## Axis Details
- **X-Axis**: "Entity ID's Sorted by Frequency"
- Range: 0 to 300
- Tick Intervals: 0, 50, 100, 150, 200, 250, 300
- **Y-Axis**: "Entity Frequency"
- Logarithmic Scale: 10⁻⁴ to 10⁻¹
- Tick Intervals: 10⁻⁴, 10⁻³, 10⁻², 10⁻¹
## Legend
- **Blue Line**: ZeroGen
- **Orange Line**: DemoGen
- **Green Line**: Ground Truth
## Key Trends
1. **Initial Decline**:
- All three lines begin near 10⁻¹ frequency at x=0.
- Sharp drop occurs between x=0 and x=50 for all datasets.
2. **Divergence Post-x=50**:
- **ZeroGen (Blue)**:
- Steepest decline after x=50.
- Frequency stabilizes near 10⁻³ by x=200.
- **DemoGen (Orange)**:
- Slower decline than ZeroGen.
- Crosses ZeroGen at x≈50, then remains above it until x≈150.
- Frequency stabilizes near 10⁻³.5 by x=200.
- **Ground Truth (Green)**:
- Maintains highest frequency throughout.
- Declines gradually after x=50, stabilizing near 10⁻³ by x=300.
3. **Logarithmic Scale Implications**:
- The steep initial drop reflects a power-law distribution.
- Ground Truth demonstrates the slowest decay rate, suggesting higher long-tail entity diversity.
## Critical Observations
- **Accuracy Verification**:
- Legend colors match line placements:
- Blue (ZeroGen) aligns with the steepest descent.
- Orange (DemoGen) shows intermediate decay.
- Green (Ground Truth) remains the highest-frequency baseline.
- **Data Completeness**:
- Ground Truth extends to x=300, while ZeroGen and DemoGen terminate at x=200.
- No overlapping data points beyond x=50 for ZeroGen and DemoGen.
## Conclusion
The chart illustrates distinct frequency decay patterns, with Ground Truth serving as the reference for optimal entity distribution. ZeroGen exhibits the most aggressive frequency reduction, while DemoGen maintains moderate decay. The logarithmic scale emphasizes the dominance of high-frequency entities across all datasets.