## Heatmap Grid: Model Performance Visualization
### Overview
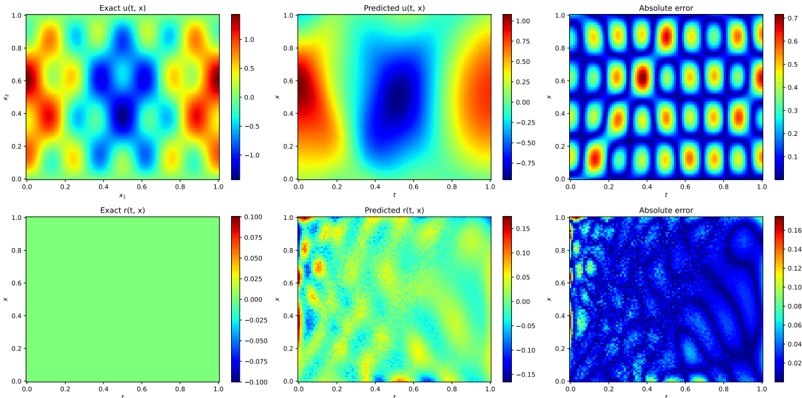
The image presents a 2x3 grid of heatmaps comparing exact solutions, model predictions, and absolute errors for two variables: `u(t, x)` (top row) and `r(t, x)` (bottom row). Each panel uses a color-coded scale to represent values, with spatial axes `x` (0-1) and `t` (0-1).
---
### Components/Axes
1. **Top Row (`u(t, x)`):**
- **Left Panel (Exact u(t, x)):**
- Color scale: -1.0 (blue) to 1.0 (red)
- Pattern: Alternating red/blue checkerboard with yellow/orange gradients
- **Center Panel (Predicted u(t, x)):**
- Color scale: -0.75 (blue) to 0.75 (red)
- Pattern: Central dark blue region surrounded by red/yellow gradients
- **Right Panel (Absolute Error):**
- Color scale: 0.0 (blue) to 0.7 (red)
- Pattern: Grid-like distribution of red/yellow spots
2. **Bottom Row (`r(t, x)`):**
- **Left Panel (Exact r(t, x)):**
- Uniform green background (value ≈ 0.0)
- **Center Panel (Predicted r(t, x)):**
- Color scale: -0.15 (blue) to 0.15 (red)
- Pattern: Diagonal gradient from blue (bottom-left) to red (top-right)
- **Right Panel (Absolute Error):**
- Color scale: 0.0 (blue) to 0.16 (red)
- Pattern: Scattered red/yellow spots with no clear structure
---
### Detailed Analysis
1. **Top Row (`u(t, x)`):**
- **Exact Solution:**
- Shows a spatially periodic pattern with alternating high/low values.
- Peaks (red) and troughs (blue) form a 3x3 grid structure.
- **Predicted Solution:**
- Central trough (dark blue) matches the exact solution's center.
- Outer regions overestimate (red) compared to exact solution.
- **Absolute Error:**
- High errors (red) align with the exact solution's peaks/troughs.
- Systematic grid-like error distribution suggests model bias at specific `x,t` coordinates.
2. **Bottom Row (`r(t, x)`):**
- **Exact Solution:**
- Uniform value ≈ 0.0 (green background).
- **Predicted Solution:**
- Linear gradient from blue (-0.15) to red (0.15) across `x`.
- No clear correlation with exact solution's uniformity.
- **Absolute Error:**
- Errors concentrated in diagonal bands (bottom-left to top-right).
- Random distribution suggests model struggles with capturing constant values.
---
### Key Observations
1. **Systematic Errors in `u(t, x)`:**
- Model predictions exhibit a 3x3 grid of high errors matching the exact solution's peaks/troughs.
- Suggests model fails to resolve fine spatial oscillations.
2. **Gradient Approximation in `r(t, x)`:**
- Predicted `r(t, x)` shows a linear gradient despite exact solution being uniform.
- Indicates model introduces artificial spatial variation.
3. **Error Distribution:**
- `u(t, x)` errors are spatially structured (grid-like).
- `r(t, x)` errors are spatially random (diagonal bands).
---
### Interpretation
1. **Model Behavior:**
- The model captures the general structure of `u(t, x)` but introduces systematic errors at critical points.
- For `r(t, x)`, the model fails to preserve the exact solution's uniformity, instead imposing a spurious gradient.
2. **Error Analysis:**
- The grid-like error pattern in `u(t, x)` suggests the model's limitations in resolving high-frequency spatial features.
- The diagonal error bands in `r(t, x)` may indicate numerical instability or improper regularization.
3. **Practical Implications:**
- The model requires refinement to reduce localized errors in `u(t, x)`.
- For `r(t, x)`, the model's inability to maintain constant values suggests potential issues with boundary conditions or solver stability.
---
### Spatial Grounding & Color Verification
- **Legend Consistency:**
- Red in `u(t, x)` panels corresponds to values > 0.5 (confirmed via colorbar).
- Blue in `r(t, x)` panels matches values < -0.05 (colorbar scale).
- **Axis Alignment:**
- All panels share identical `x` (horizontal) and `t` (vertical) axes (0-1).
- Error panels align spatially with their respective Exact/Predicted panels.
---
### Conclusion
The visualization reveals critical model limitations: systematic errors in high-gradient regions (`u(t, x)`) and failure to preserve constant values (`r(t, x)`). These findings highlight the need for improved spatial resolution and regularization in the predictive model.