## Heatmap: Pixelated Radial Pattern
### Overview
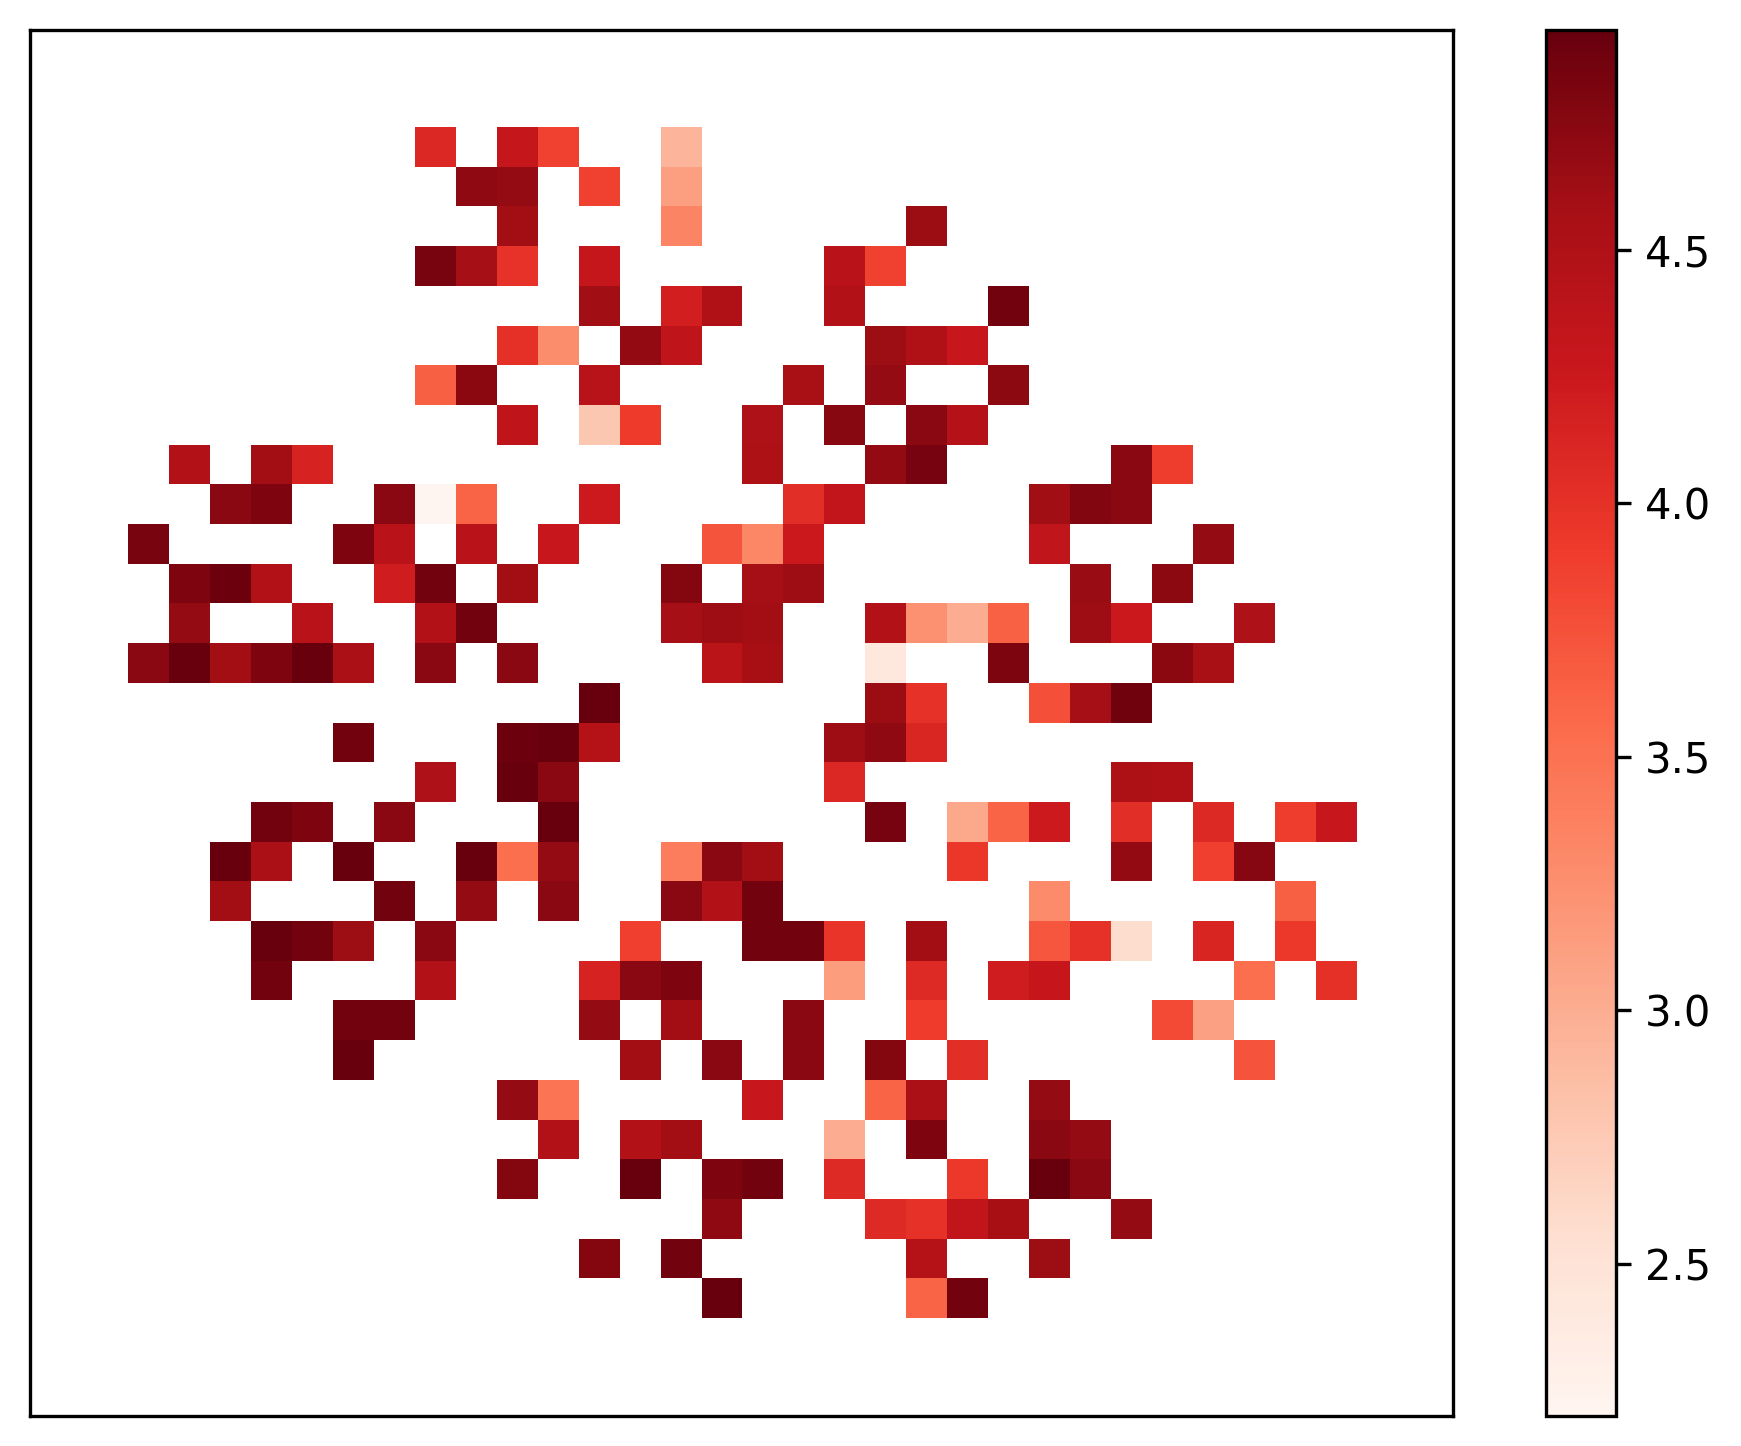
The image is a heatmap displaying a pixelated radial pattern. The pattern is composed of square pixels of varying shades of red, indicating different values. The heatmap is contained within a square frame. A colorbar on the right side of the image provides a scale for interpreting the color intensities.
### Components/Axes
* **Colorbar:** Located on the right side of the image. It ranges from approximately 2.5 (lightest shade of red) to 4.5 (darkest shade of red). The colorbar has tick marks at 2.5, 3.0, 3.5, 4.0, and 4.5.
* **Pixel Grid:** The main area of the image contains a grid of square pixels. The pixels are arranged in a roughly circular or radial pattern, with varying densities and intensities of red.
### Detailed Analysis
* **Pixel Values:** The pixel values are represented by the shades of red. Darker red pixels correspond to higher values (closer to 4.5), while lighter red pixels correspond to lower values (closer to 2.5).
* **Pattern Distribution:** The pattern appears to be a somewhat fragmented radial distribution. There are clusters of higher-value (darker red) pixels in certain areas, while other areas have lower-value (lighter red) pixels or are empty (white).
* **Specific Pixel Values (Approximate):**
* Darkest Red Pixels: ~4.5
* Medium Red Pixels: ~3.5
* Lightest Red Pixels: ~2.5
### Key Observations
* The heatmap displays a non-continuous, pixelated radial pattern.
* The values range from approximately 2.5 to 4.5, as indicated by the colorbar.
* The distribution of values is uneven, with clusters of high and low values.
### Interpretation
The heatmap likely represents some form of spatial data where the intensity of red corresponds to a specific value at that location. The radial pattern suggests that the data might be related to a circular or spherical phenomenon. The fragmented nature of the pattern could indicate discontinuities or variations in the underlying data. Without additional context, it's difficult to determine the exact meaning of the data, but the heatmap provides a visual representation of the spatial distribution of values within the specified range.