## Heatmap: Symmetrical Distribution of Values
### Overview
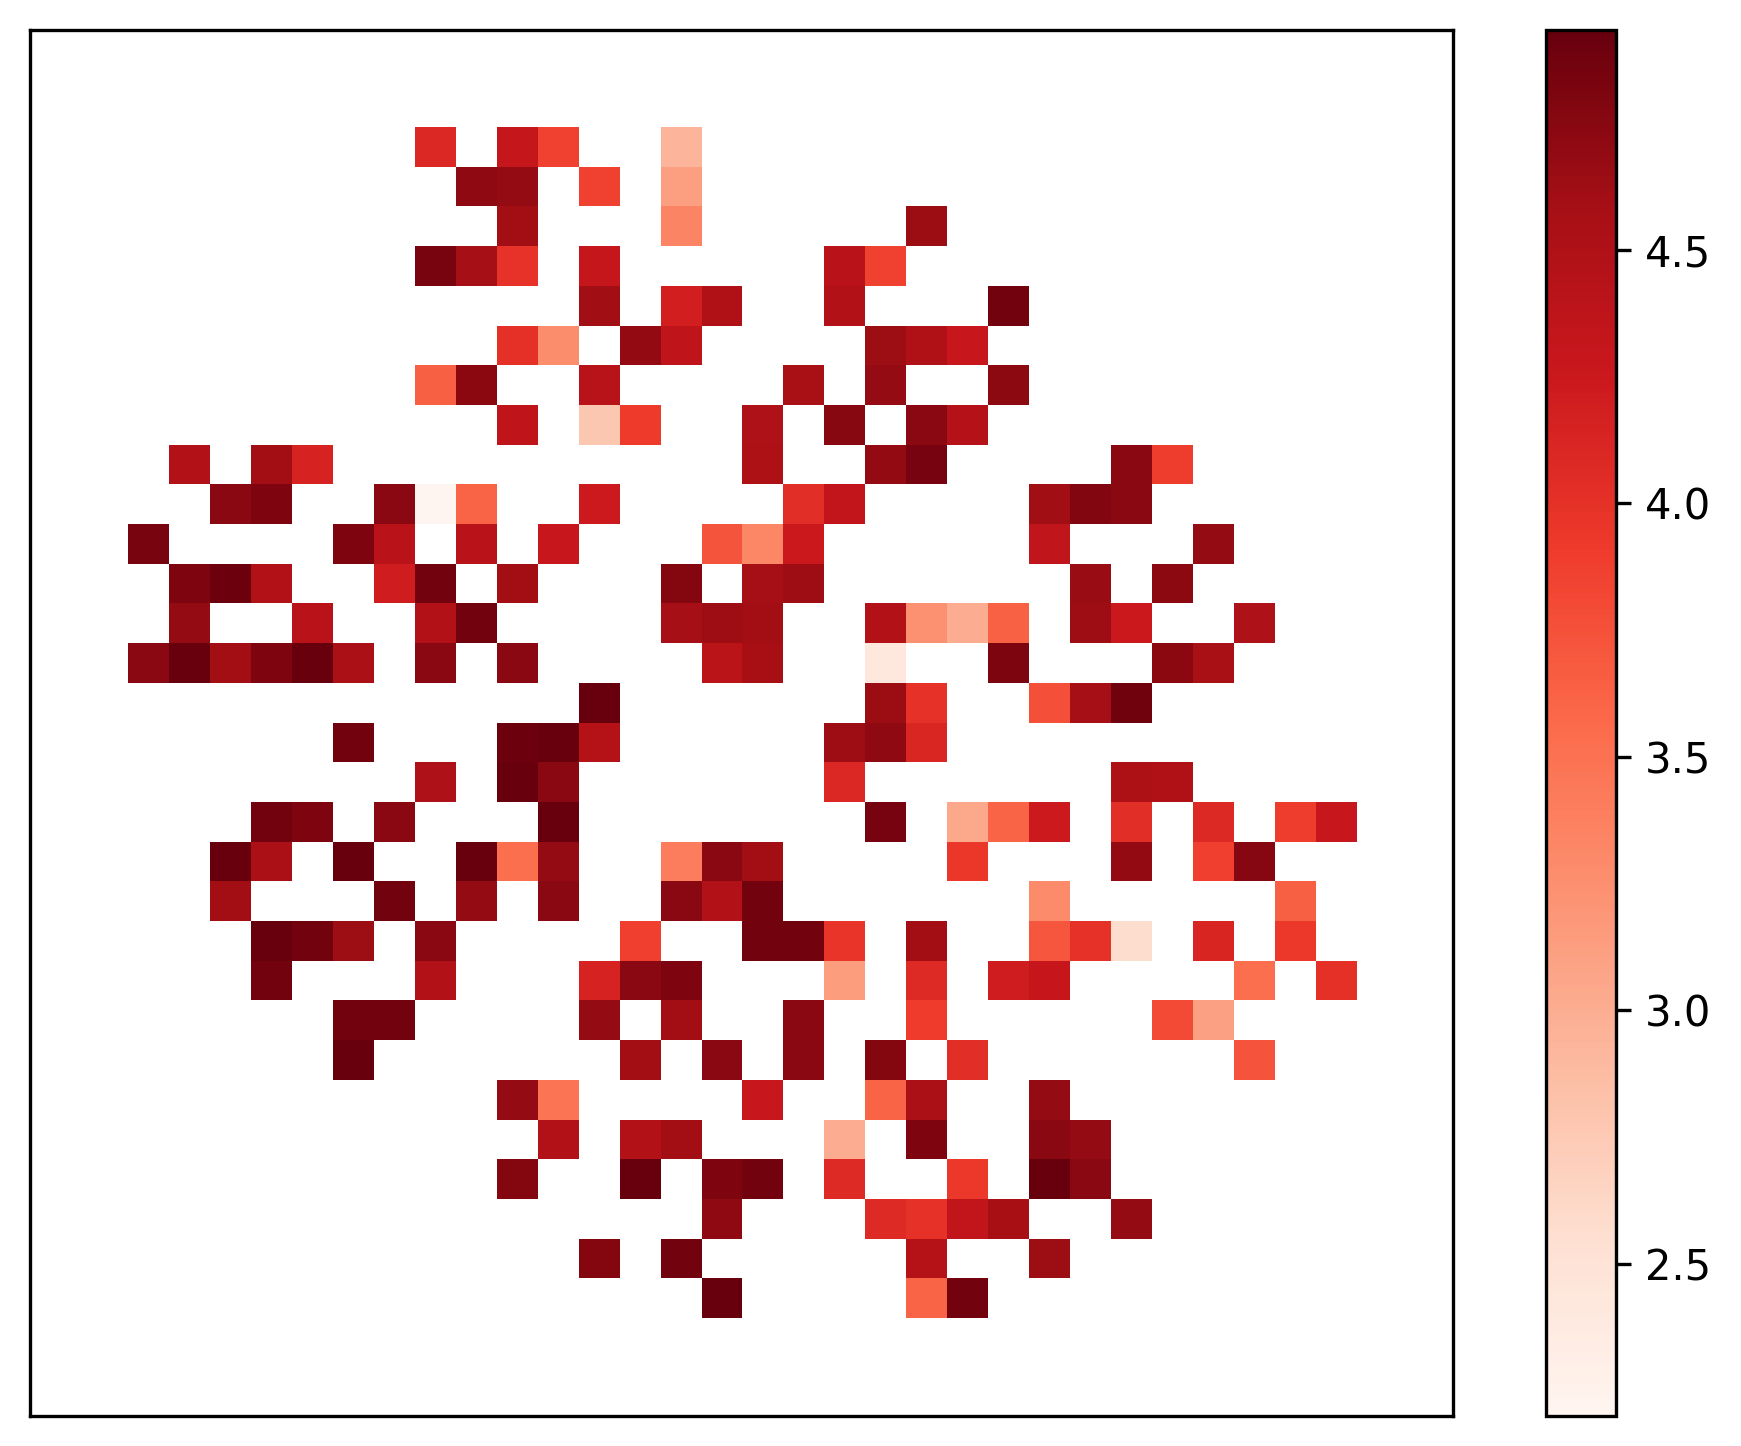
The image depicts a symmetrical heatmap composed of a grid of colored squares arranged in a radial or floral pattern. The color intensity transitions from dark red (high values) to light orange (low values), with a central region of lighter shades. The grid exhibits rotational symmetry, with darker clusters concentrated in the top-left and bottom-right quadrants.
### Components/Axes
- **Color Scale**: Vertical legend on the right, labeled from 2.5 (lightest orange) to 4.5 (darkest red).
- **Grid Structure**:
- Rows and columns form a matrix of squares.
- No explicit axis labels or categories are provided.
- Symmetry suggests a radial or mirrored design.
### Detailed Analysis
- **Value Distribution**:
- **High Values (4.0–4.5)**: Dominant in the top-left and bottom-right quadrants, forming dense clusters.
- **Medium Values (3.0–3.5)**: Found in transitional zones between high-value clusters and the center.
- **Low Values (2.5–3.0)**: Concentrated in the central region, creating a lighter core.
- **Symmetry**: The pattern mirrors itself across both horizontal and vertical axes, suggesting a designed or balanced dataset.
- **Color Gradient**: Smooth transitions between shades indicate gradual value changes, with no abrupt jumps.
### Key Observations
1. **Clustered Extremes**: The top-left and bottom-right quadrants contain the highest values, while the center has the lowest.
2. **Radial Pattern**: The symmetry implies a central focal point influencing the distribution.
3. **No Outliers**: All values fall within the 2.5–4.5 range; no isolated anomalies are visible.
### Interpretation
The heatmap likely represents a system with a central influence, where peripheral regions exhibit higher values. The symmetry suggests a balanced or cyclical process, such as:
- **Signal Strength**: A central transmitter with diminishing intensity toward the edges.
- **Stress Distribution**: A material under uniform load, with stress concentrated at specific points.
- **Data Clustering**: A dataset organized around a core category, with peripheral categories showing higher frequency or magnitude.
The absence of axis labels limits precise interpretation, but the visual pattern emphasizes a designed, symmetrical relationship between the grid positions and their corresponding values. The central "void" of low values could indicate a null or baseline state, while the outer clusters represent active or extreme conditions.